Report builder Overview
Navigating to Report Builder Reports
Under the “Reporting” dropdown field, user have the option to select a specific report which will bring you to a dedicated page for that report:
Selecting a report type will navigate you to a new reporting pane. Having landed on the Report Builder page, you can move from one report type to another by selecting report type from the dropdown again. If a user has restricted access to one or more reports (as set at the Role), those reports will not appear in this dropdown.
Building Reports
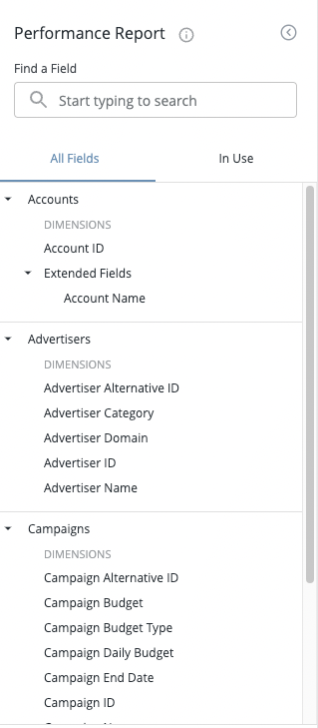
We now distinguish between “Dimensions” and “Measures” . These objects specify fields to group by and to associate desired metrics. You can distinguish these objects from one another in the UI as Dimensions will be in black and Measures will be in gold in the field selection sidebar. Thematically related fields are grouped together within a collapsible tree for ease of navigation and UI cleanliness.
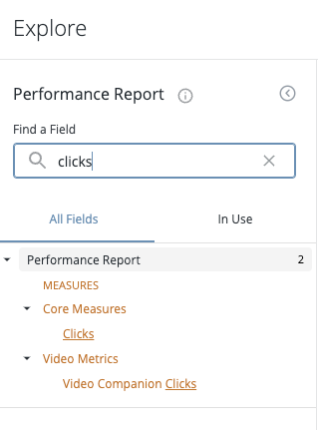
Users can also search for a specific field:
To run the report click on the “Run” button in the top right corner. Selecting different Dimensions and Measures will add column headers to the report pane, in order to illustrate the format the report will take once it has been run. You can drag and drop the columns to re-order them (with measurements staying on the far right to allow for grouping).
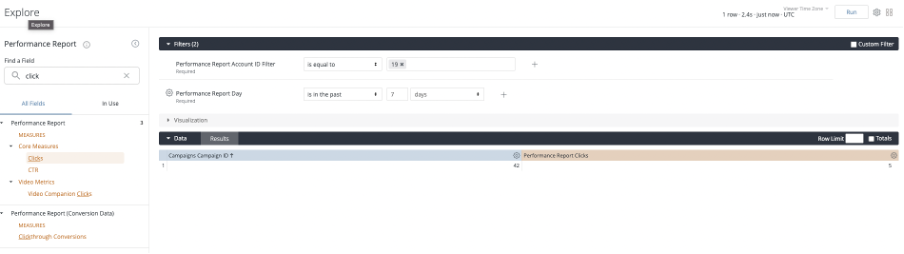
You can sort results by clicking on the column header, with a caret appearing to illustrate whether the results will be in Ascending or Descending order. Users will also be able to filter on both Dimensions and Measures by either clicking on the gear icon in the column header to open a drop-down, or by using the Filter label alongside the Measures in the sidebar.
Filters can be combined using AND and OR conjunctions, as well as using more advanced operators such as ‘contains’, ‘is equal to’, ‘does not contain’, ‘is not equal to’ etc.

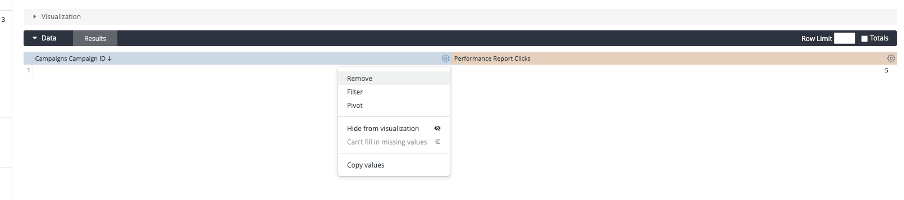
Report builder also allows you to pivot your results, reducing the need for external spreadsheet software.
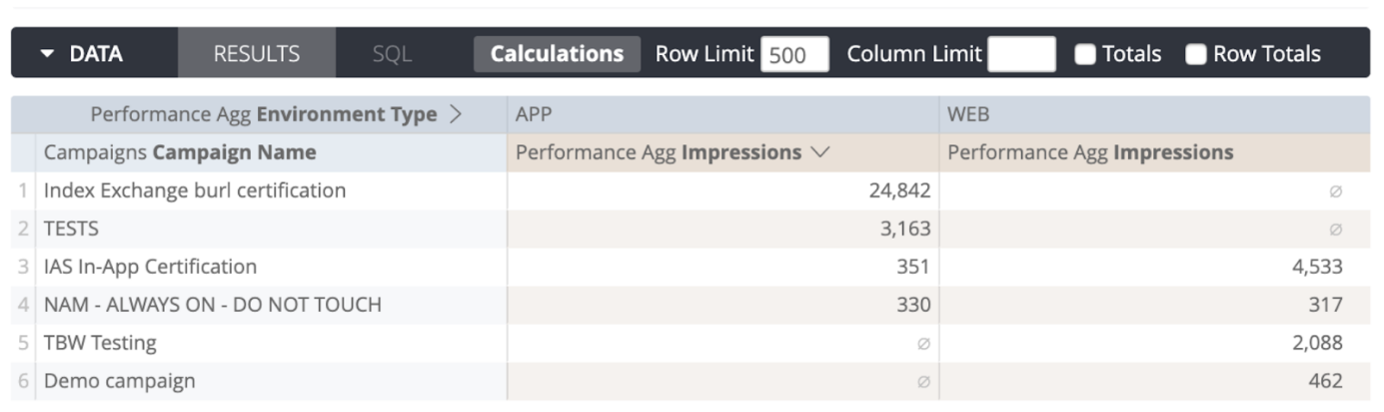
In order to pivot data by a specific dimension, click on the ‘Pivot’ option when selecting a field to add to the report.
Visualizations
The powerful features of Report Builder allow users to visualize the data displayed in the results pane within the same view. In order to start building a visualization, start by uncollapsing the ‘Visualization’ tab and choose a chart or visualization type from the available options. The tool will automatically try to interpret the data within the results section and apply the most logical and applicable visualization. You can also toggle and adjust different settings in order to change axes and create a more intuitive graphic. When a report containing a visualization is saved, the configured visualization will also be saved alongside the report.
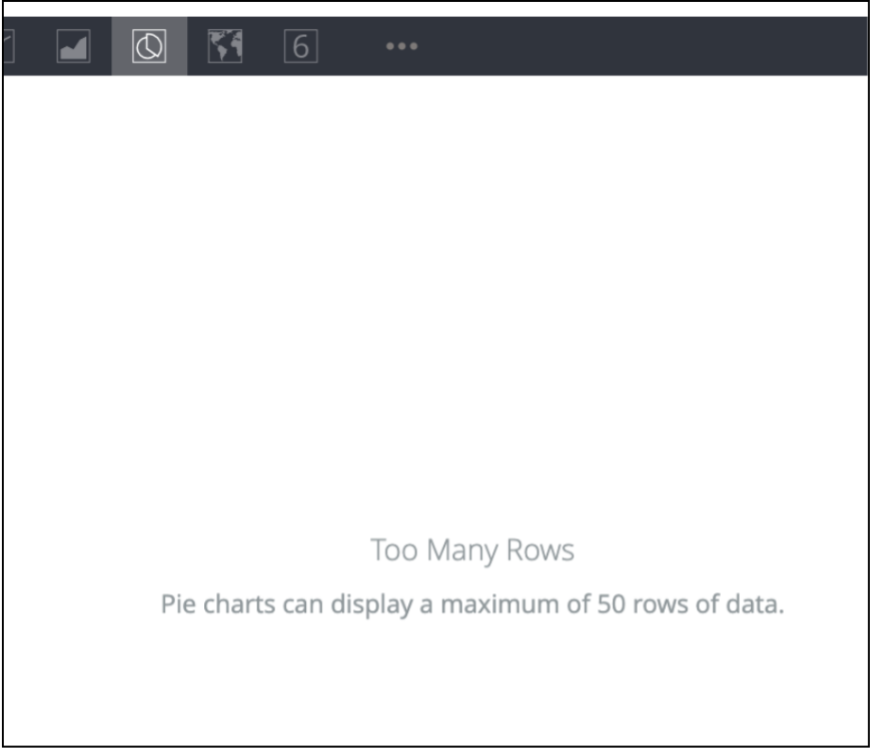
Note that certain visualizations may not be compatible with the results data (e.g. Too Many Rows), however, you will receive detailed feedback on your screen when this occurs.
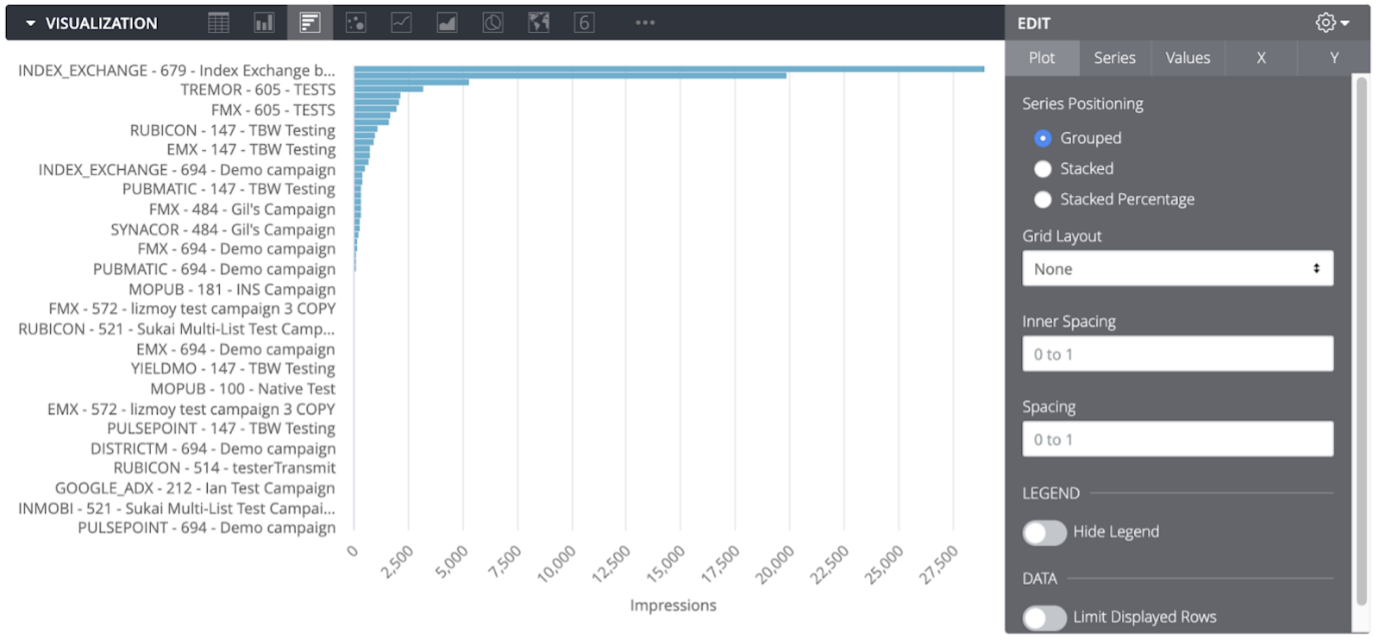
In order to fine-tune your visualizations, you can use the Edit bar on the side: You can also specify which fields should not appear in the visualization.
Saved Reports
Report Builders allows you to save reports for future reference. Once a query/report has been run at least once, the option will appear within the gear icon in the top right hand corner to “Save as a Look...”.
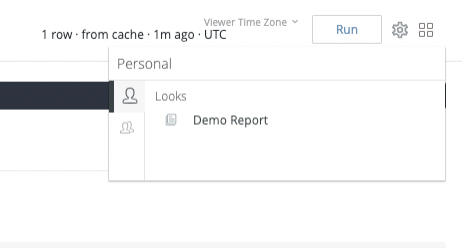
You will be prompted to give the report a saved name. To access this report in the future, you should pick any report from the Reporting Dropdown. In the top right-hand corner of any report, there will be an icon of four tiles. Clicking it will reveal all saved reports.
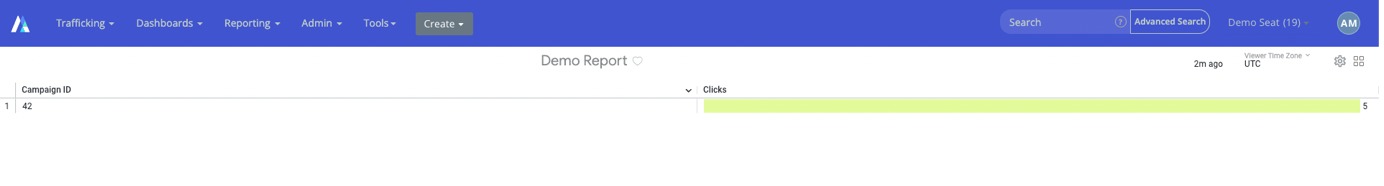
Clicking on the report will re-run the associated report and display the saved Visualization. Editing an existing saved report is easy. Clicking on the gear icon will reveal an option to “Explore from Here”, which will return you to the Report Builder view for this specific report.
Downloading Reports
The option to download report results can be found by clicking the gear in the top right corner and selecting the “Download” option after the report has been run. This will open the following modal allowing you to specify criteria for the download file.
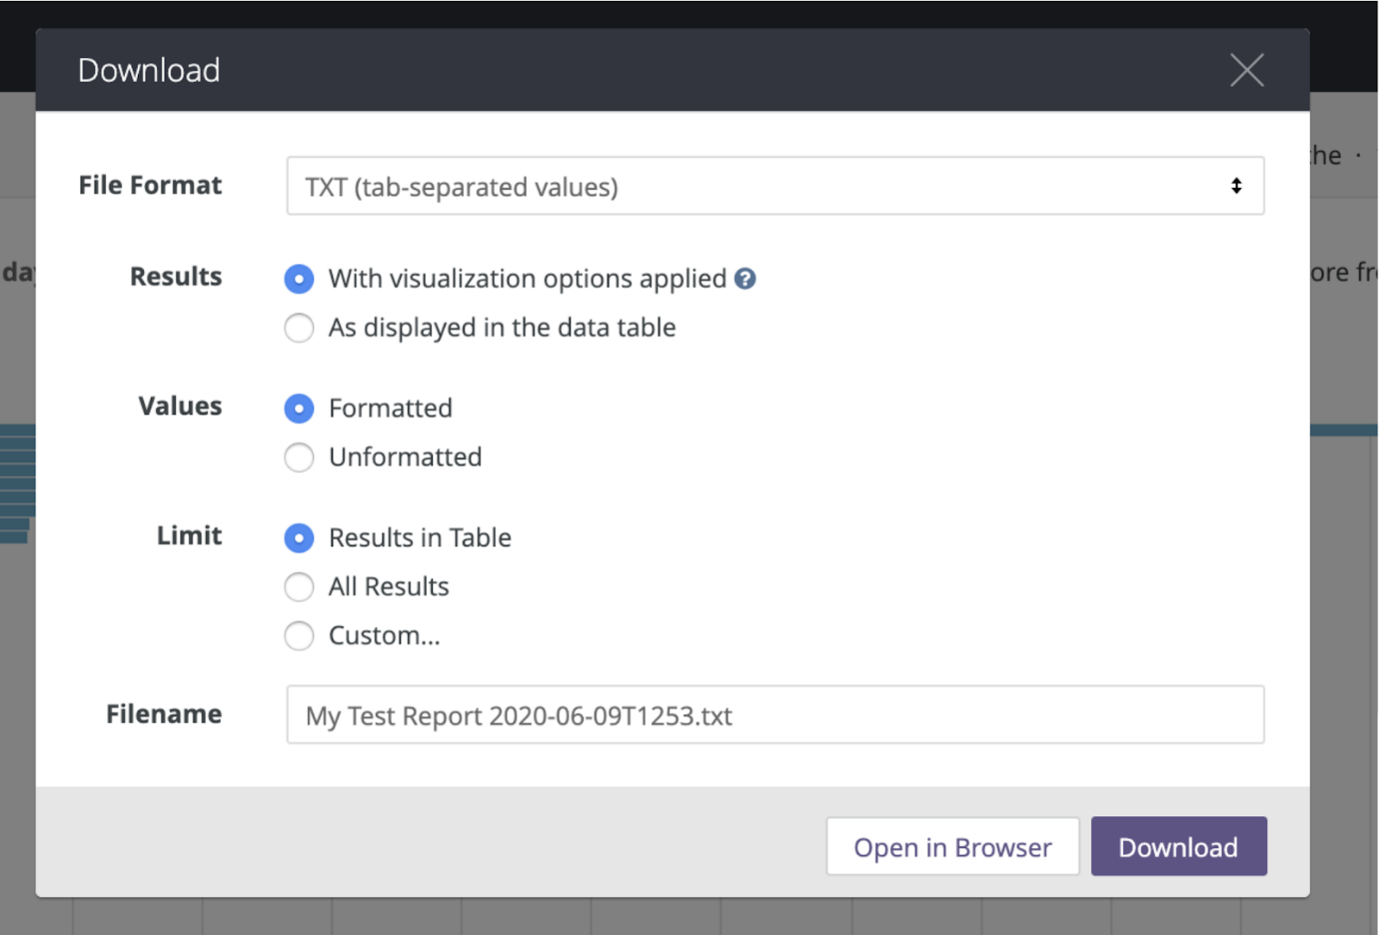
All of the following file formats are supported by Report Builder:
- TXT
- XLSX
- CSV
- JSON
- HTML
- Markdown
- PNG (of the Visualization)
Users can export a boundless set of report results by choosing the “All Results” option under “Limit”, so users of Report Builder will not be subject to a maximum row limit when downloading their report results.
Sending and Scheduling Reports
If you would like to export data out of Report Builder to another system, they can do this either on a scheduled cadence or an ad hoc basis using one of many new delivery methods: email, S3, SFTP, and webhooks.
To send a report to another system or client on an ad hoc basis, select the “Send…” option from the gear menu in the top-right corner. This will open a modal with sending options.
In order to schedule a report to be run at a specific time, and the results to be sent to certain recipients, you will receive a list of options as well as the scheduled window. Important: Please reach out to your AIDEM DSP Account Manager before setting up any reports which will run on an ‘Hourly’ (or less) schedule.
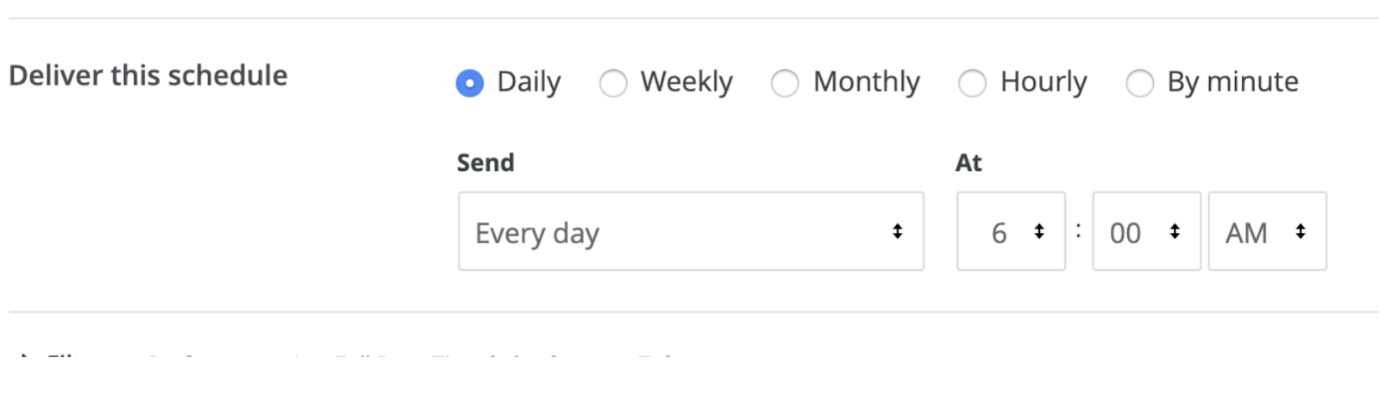
The schedule window can be chosen down to 5-minute increments.

Dashboards
AIDEM DSP allows users to create custom dashboards based on the functionality of Report Builder. This offers a powerful visualization tool which can help you keep on top of the performance and delivery of your campaigns from one central location, and with custom permissioning these can also be exposed directly to read-only Users with custom Roles (e.g. clients or partners).
AIDEM DSP also includes standard dashboards which offer a summary of activity across your account.
Accessing Dashboards
Dashboards are visible in the AIDEM DSP UI via the ‘Dashboard’ header dropdown. All customers will have a "Performance Dashboard" to start.
Creating a Dashboard
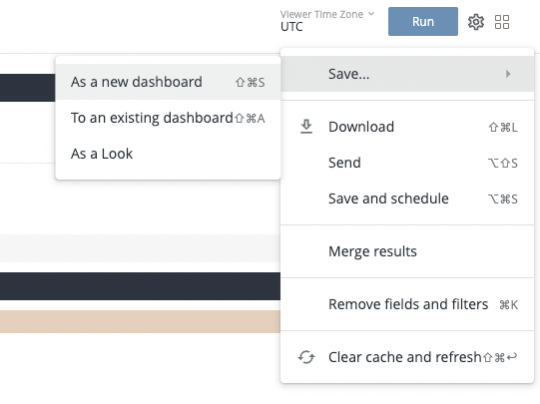
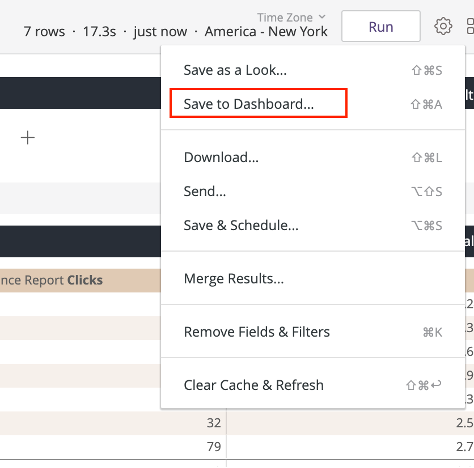
You can create your own dashboards in Report Builder by using the ‘Save to Dashboard’ option under the Report Builder settings. By default, these dashboards will only be visible to you.
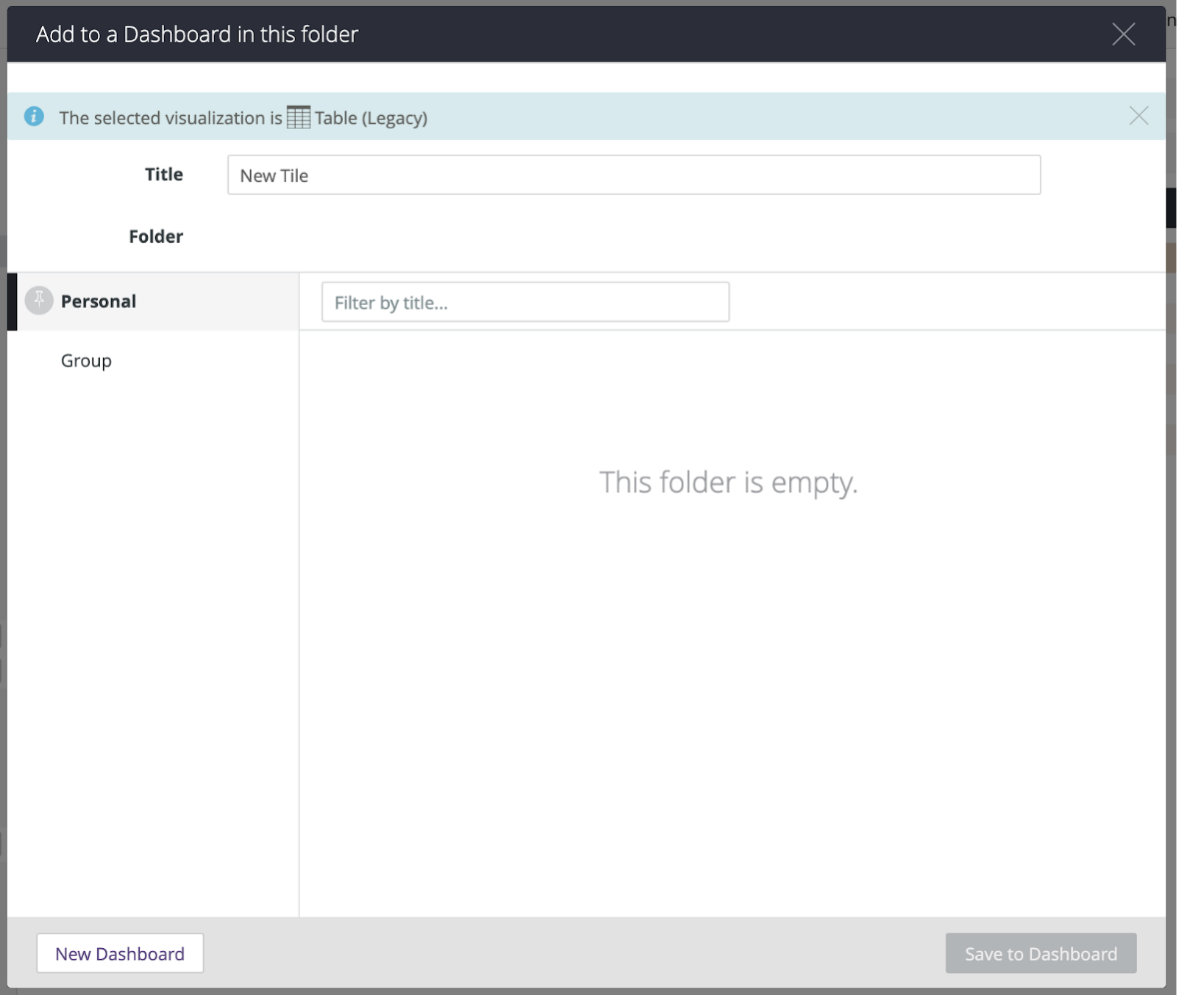
You can then either choose to create a “New Dashboard” or choose an existing one to add your new tile/visualization.
Dashboard Permissions
Dashboard permissions are available via Link:Roles (Roles and permission). When a new Dashboard is added to your account list of available Dashboards, it will appear as a new option within Role Permissions.
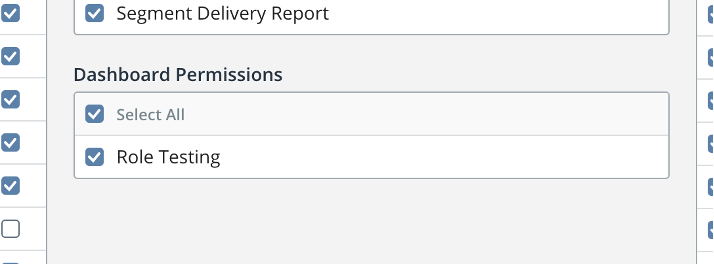
You can therefore use Roles to decide which Users on your platform will have access to which Dashboards. If you have restricted which Roles can access specific measures in reports using the Reporting Field Groups, these permissions will be respected if those same measures are present in the dashboard. For example, you might disallow a Role from seeing the "revenue" measure, but if that “revenue” measure is included in a Dashboard to which the same Role has access the field will be hidden. Note that this may cause some Dashboards to appear differently than intended or display errors.
Example Use Case
You have an automotive client which has their own separate Account (via Multi-account) on your Buzz Key. You would like to keep them up to date on the performance of their Campaigns.
You begin by creating custom tiles via report types in Report Builder using their Campaign IDs as filters and then add the tiles to a custom Dashboard. You provide the name of the Dashboard to AIDEM Support who will then add this Dashboard to your list of available Dashboards on your Buzz Key, and optionally restrict the Dashboard to only the Account for that advertiser.
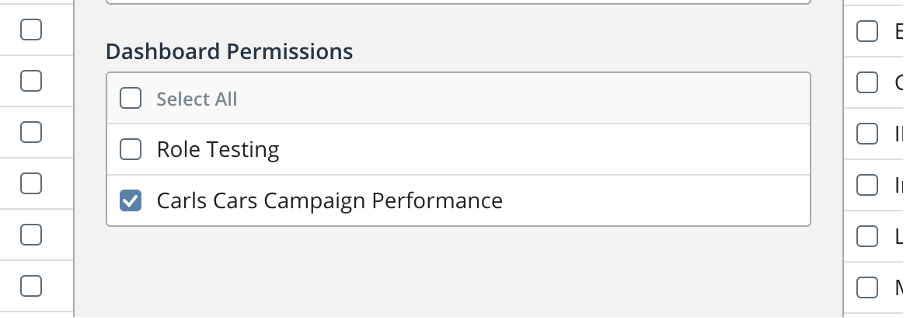
You create a new Role for the client. This new Role has all Dashboard Permissions unchecked, apart from the Dashboard in question (which was added as a permission object when it was added to your available Dashboards).
FAQs
What types of Data Visualizations are available out of the box?
Standard data visualization types are available: bar, column, line, pie, area charts, and more.
Can I hide the new Report Builder from some of my users in the same way I could hide Query Tool?
Yes, like before you can still hide reporting and individual reports from your users.
What does this mean for the old Dashboard Page and the Visual Geo Report?
The Geo Report (Beta) page will be retired soon. We plan on updating the Dashboard page soon. In the interim, both of these reports will still be available for your use.
Does this impact and/or interact with Metamarkets at all?
No, your Metamarkets integration is unchanged, and you can still continue to use it as before to visualize and understand inventory and performance.
The Report Builder defaults date filtering to the last seven days. Why is this / can this be changed?
Most reports customers request are for recent periods of time, and including this filter makes the query performance much faster. As of now, this default cannot be changed.