Real Time Bidding Stats
Real Time Bidding Stats provides real-time data on the delivery of line items and allows you to make better and faster decisions.
Real Time Stats Graph
The Real Time Stats graph can be found on the ‘overview’ tab of a line item, and includes real-time bid and win stats for the line item. Mousing over the graph will show an estimated count for bids and impressions.
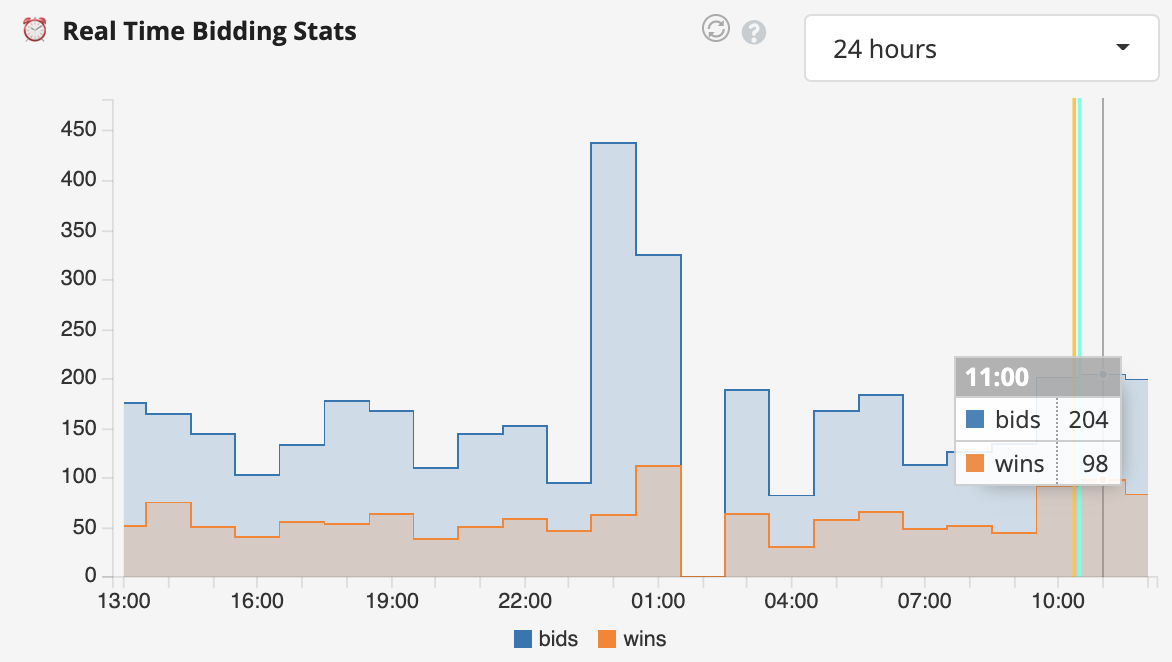
Note: Due to the real time nature of the data, it is generally within 10-15% of the actual bid and win numbers, and is meant to be used directionally for troubleshooting and decision making purpose. The data is delayed by ~1 minute.
Some use cases for the graph include:
- Is my line item bidding right now? If so, what is the current bid rate?
- Is my line item winning right now? If so what is the current win rate?
- How have my bids/wins trended in the past several hours or past few days?
- How have the changes I made to my line item/campaign affected my bid rate and win rate?
- e.g. I opened up targeting...how much did my bid rate increase?
- e.g I restricted my frequency cap….how much did my bid rate decrease?
There is a range of lookback windows for the graph with varying granularity:
- 1 hour lookback: 1 minute granularity
- 3 hour lookback: 1 minute granularity
- 6 hour lookback: 5 minute granularity
- 12 hour lookback: 5 minute granularity
- 24 hour lookback: 60 minute granularity
- 48 hour lookback: 60 minute granularity
- 72 hour lookback: 60 minute granularity
The activities table below the graph plots a vertical colored line on the graph that correlates to a specific change made to the line item or the campaign it is associated with. The table can be used to track how specific changes effect bidding/winning. Clicking on the event in the activity table will show the particular change made in the activity log.
Please note there is a 5 minute delay between making changes to a line item and the change taking effect, therefore it may take up to 5 minutes for a line item to show bidding once made active, and it may take up to 5 minutes after a line item is made inactive for it to stop bidding.
Real Time Status
Real time status is available in the line item table view and provides the bidding and winning status of a line item:
- Bidding Now: Is the line item bidding? Yes/no
- Winning Now: Is the line item winning? Yes/no
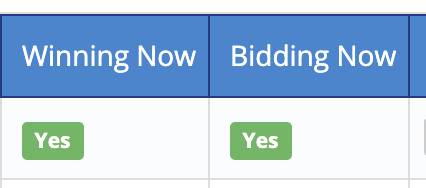
The “Yes” status means the line item has had greater than 0 bids/wins in the past 5 minutes. The “no” status means the line item has had 0 bids/wins in the past 5 minutes.****
The order of the status columns and their visibility can be changed by clicking on the "Customize Fields" button.
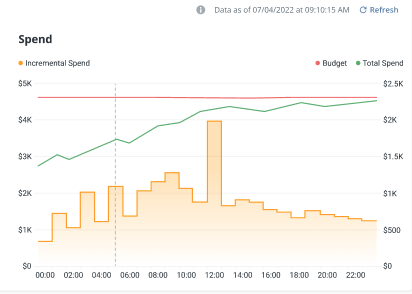
Spend Graph
Spend graph includes the incremental spend, total budget for the line item, and total spend of your line item.
- On the X-axis, the graph displays the time of the line item.
- On the left Y-axis, the graph displays the total budget of the line item.
- The right Y-axis shows the cumulative spend across the incremental spend and budget.
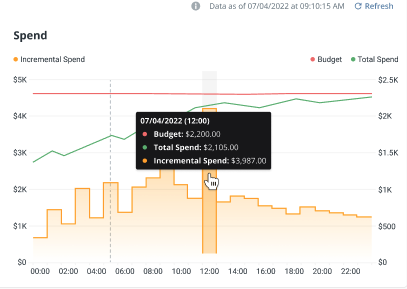
- The yellow line shows the incremental spend, the green line shows the total spend, and the red line shows the budget.
- You can view additional details for the specific budget, total spend, and incremental spend by hovering over each line with your mouse. This will display a black text box with the details and date.