Quick Stats
The Quick Stats panel appears on the right-side of the General, Targeting, Analytics, and Summary pages. It shows key information for your Line Item and Campaign.
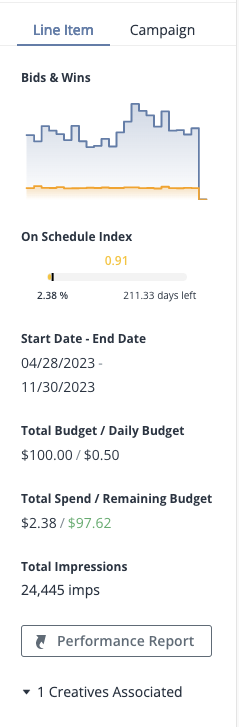
- Bids & Wins: This graph pulls data of the past 6 hrs for your line item.
- On Schedule Index: Like our List View OSI indicator, this chart shows:
- Time % (Black bar calculation) - Hours remaining / Total hours
- Budget % (Progress bar calculation / Number on the bottom left) - (Total flight budget – Flight spend) / Total flight budget
- Index calculation - Budget % / Time %
- Start Date and End Date for your line item
- Total Budget / Daily Budget
- Total Spend / Remaining Budget
- Total Impressions
- Performance Report link: This link directs to a curated report set to your line item that shows:
- Line item ID
- Line Item Name
- Last 7 days metrics for:
- Day
- Creative ID
- Impressions
- Spend
- Clicks
- CTR
- Video Complete Percent
- Number of associated creatives