Analytics
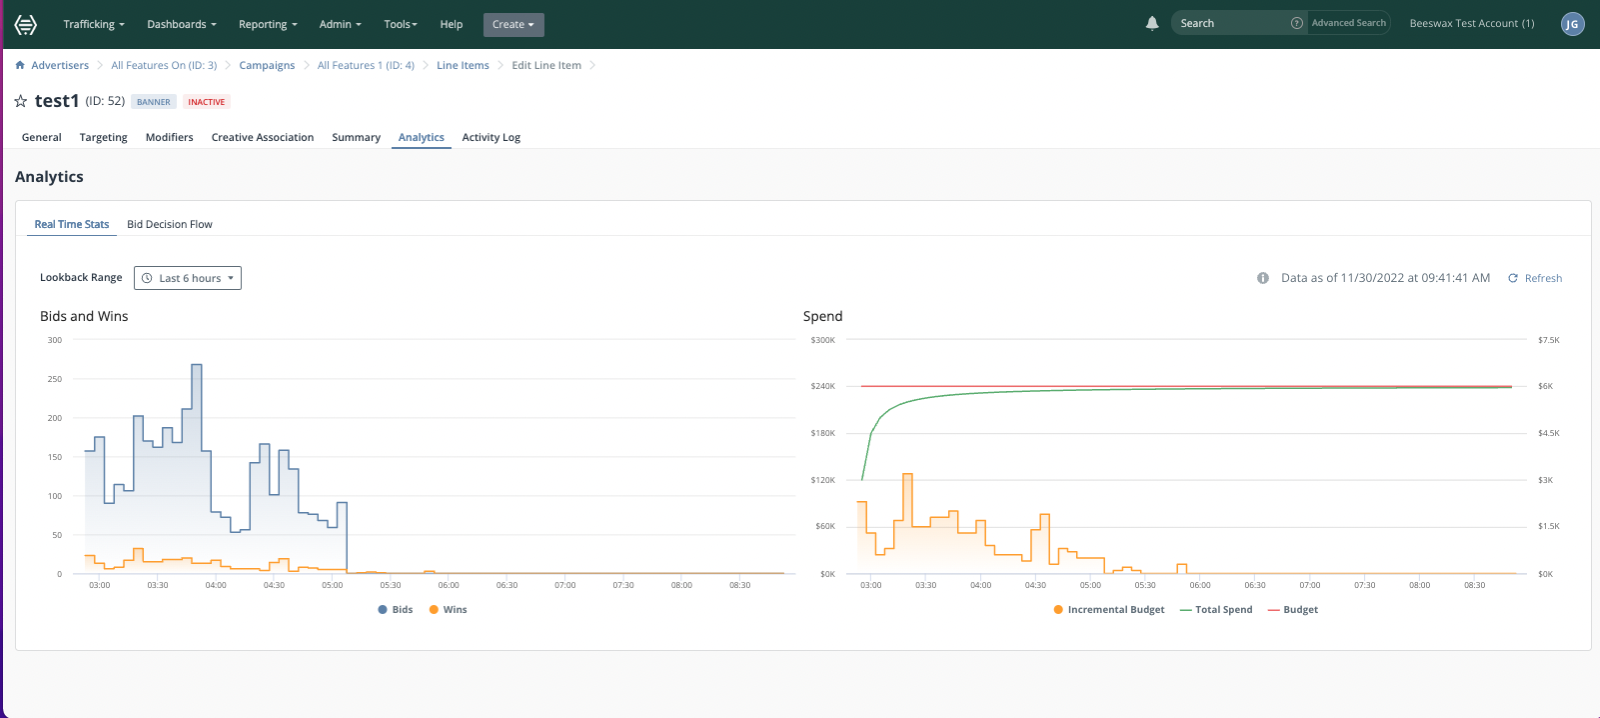
The analytics tab shows two charts, Real Time Stats and Bid Decision Flow graphs. These charts display information about your line item so that you can help understand its performance. Note: You will see a new chart called Spend.
Real Time Stats and Spend
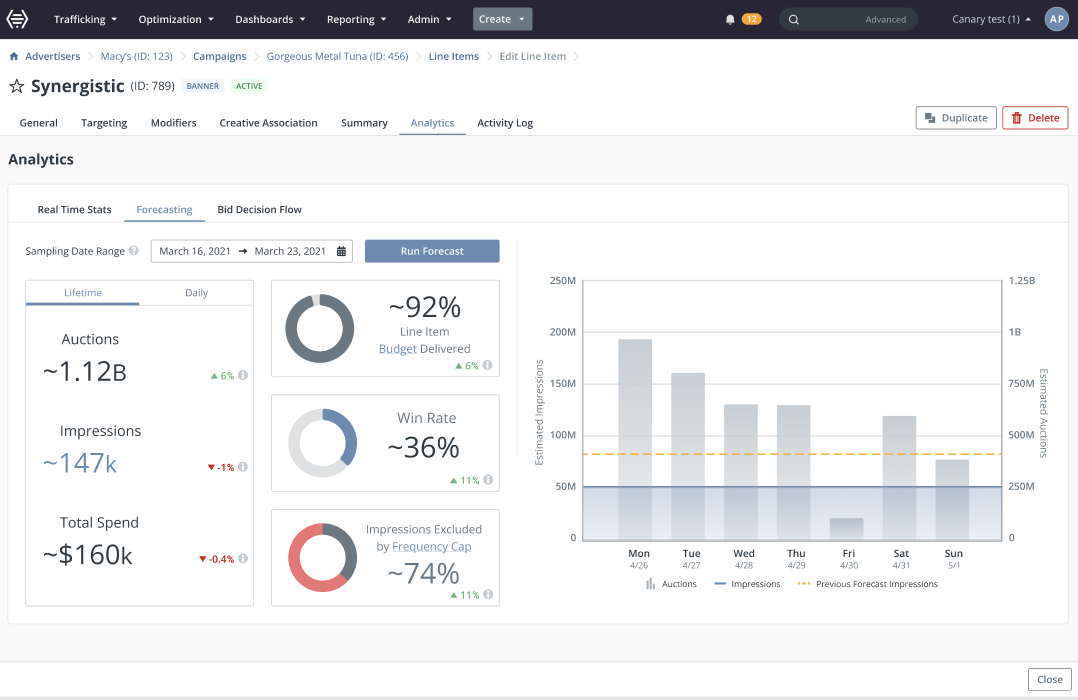
Forecasting
The forecasting tool provides customers with a projected number of available auctions for purchase based on matching targeting and creative parameters.
Bid Decision Flow
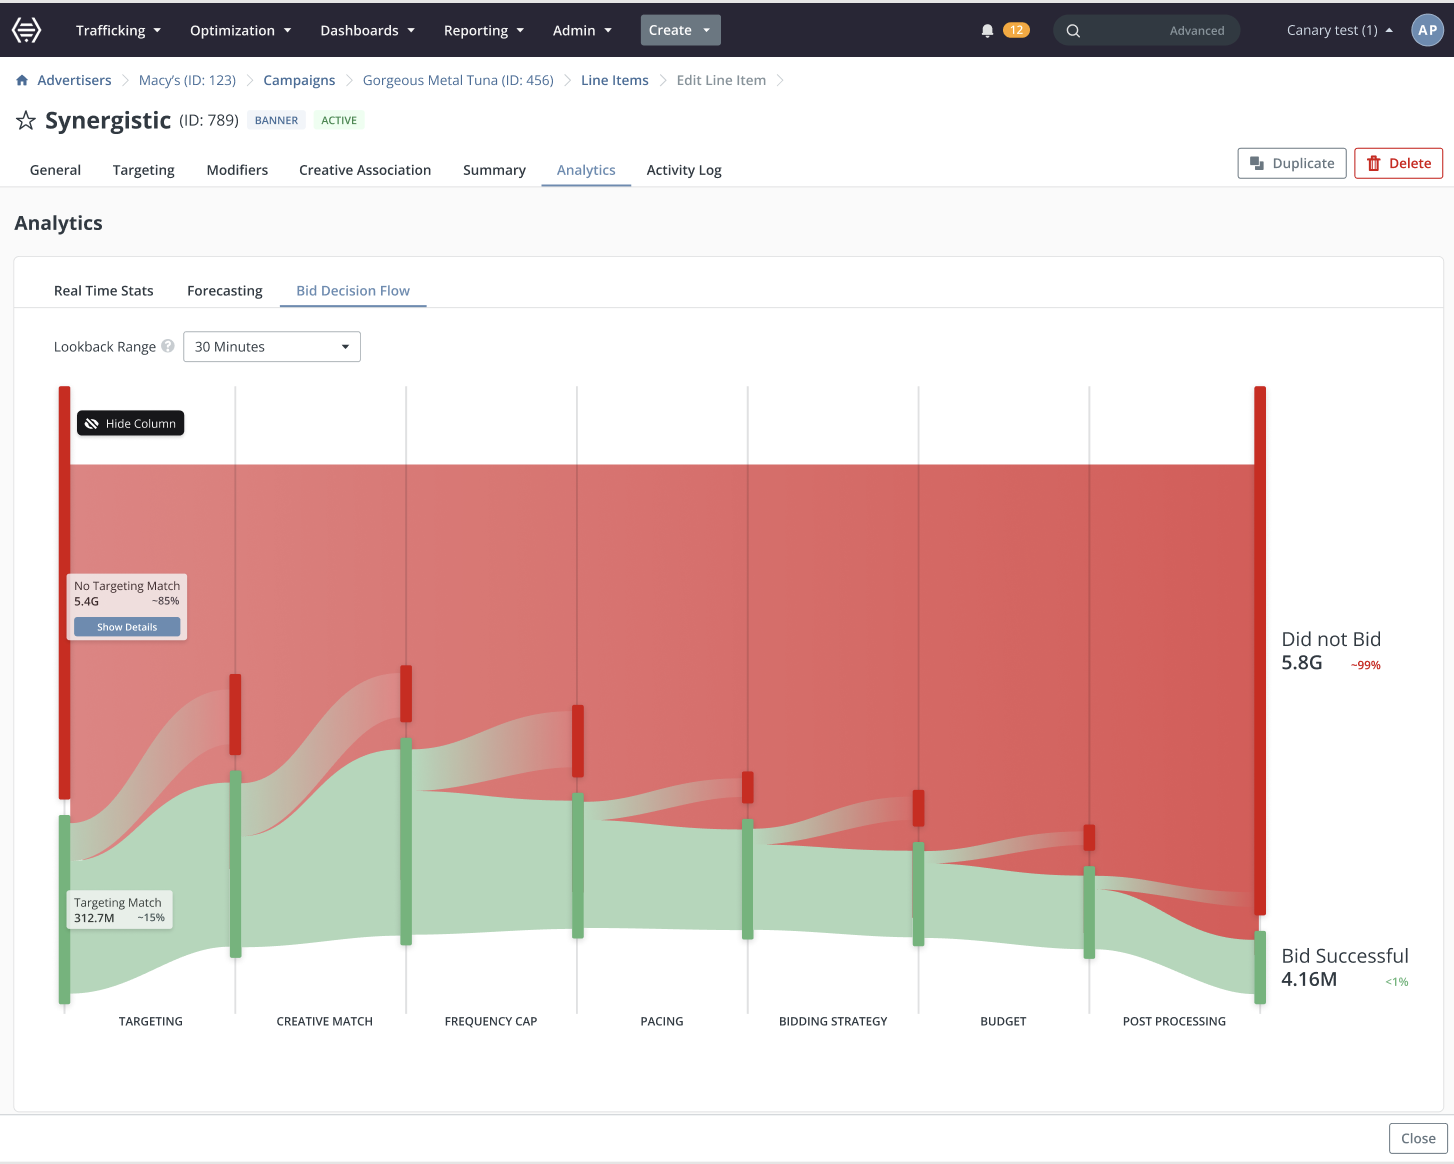
For more info read Bid Decision Flow page