Introduction
AIDEM Analytics is a simple and powerful analytics tool which lets anyone learn and make decisions from their company’s advertising data with no technical knowledge required. You can save your questions, and group questions into handsome dashboards. AIDEM Analytics also makes it easy to share questions and dashboards with the rest of your team.
Ask Questions
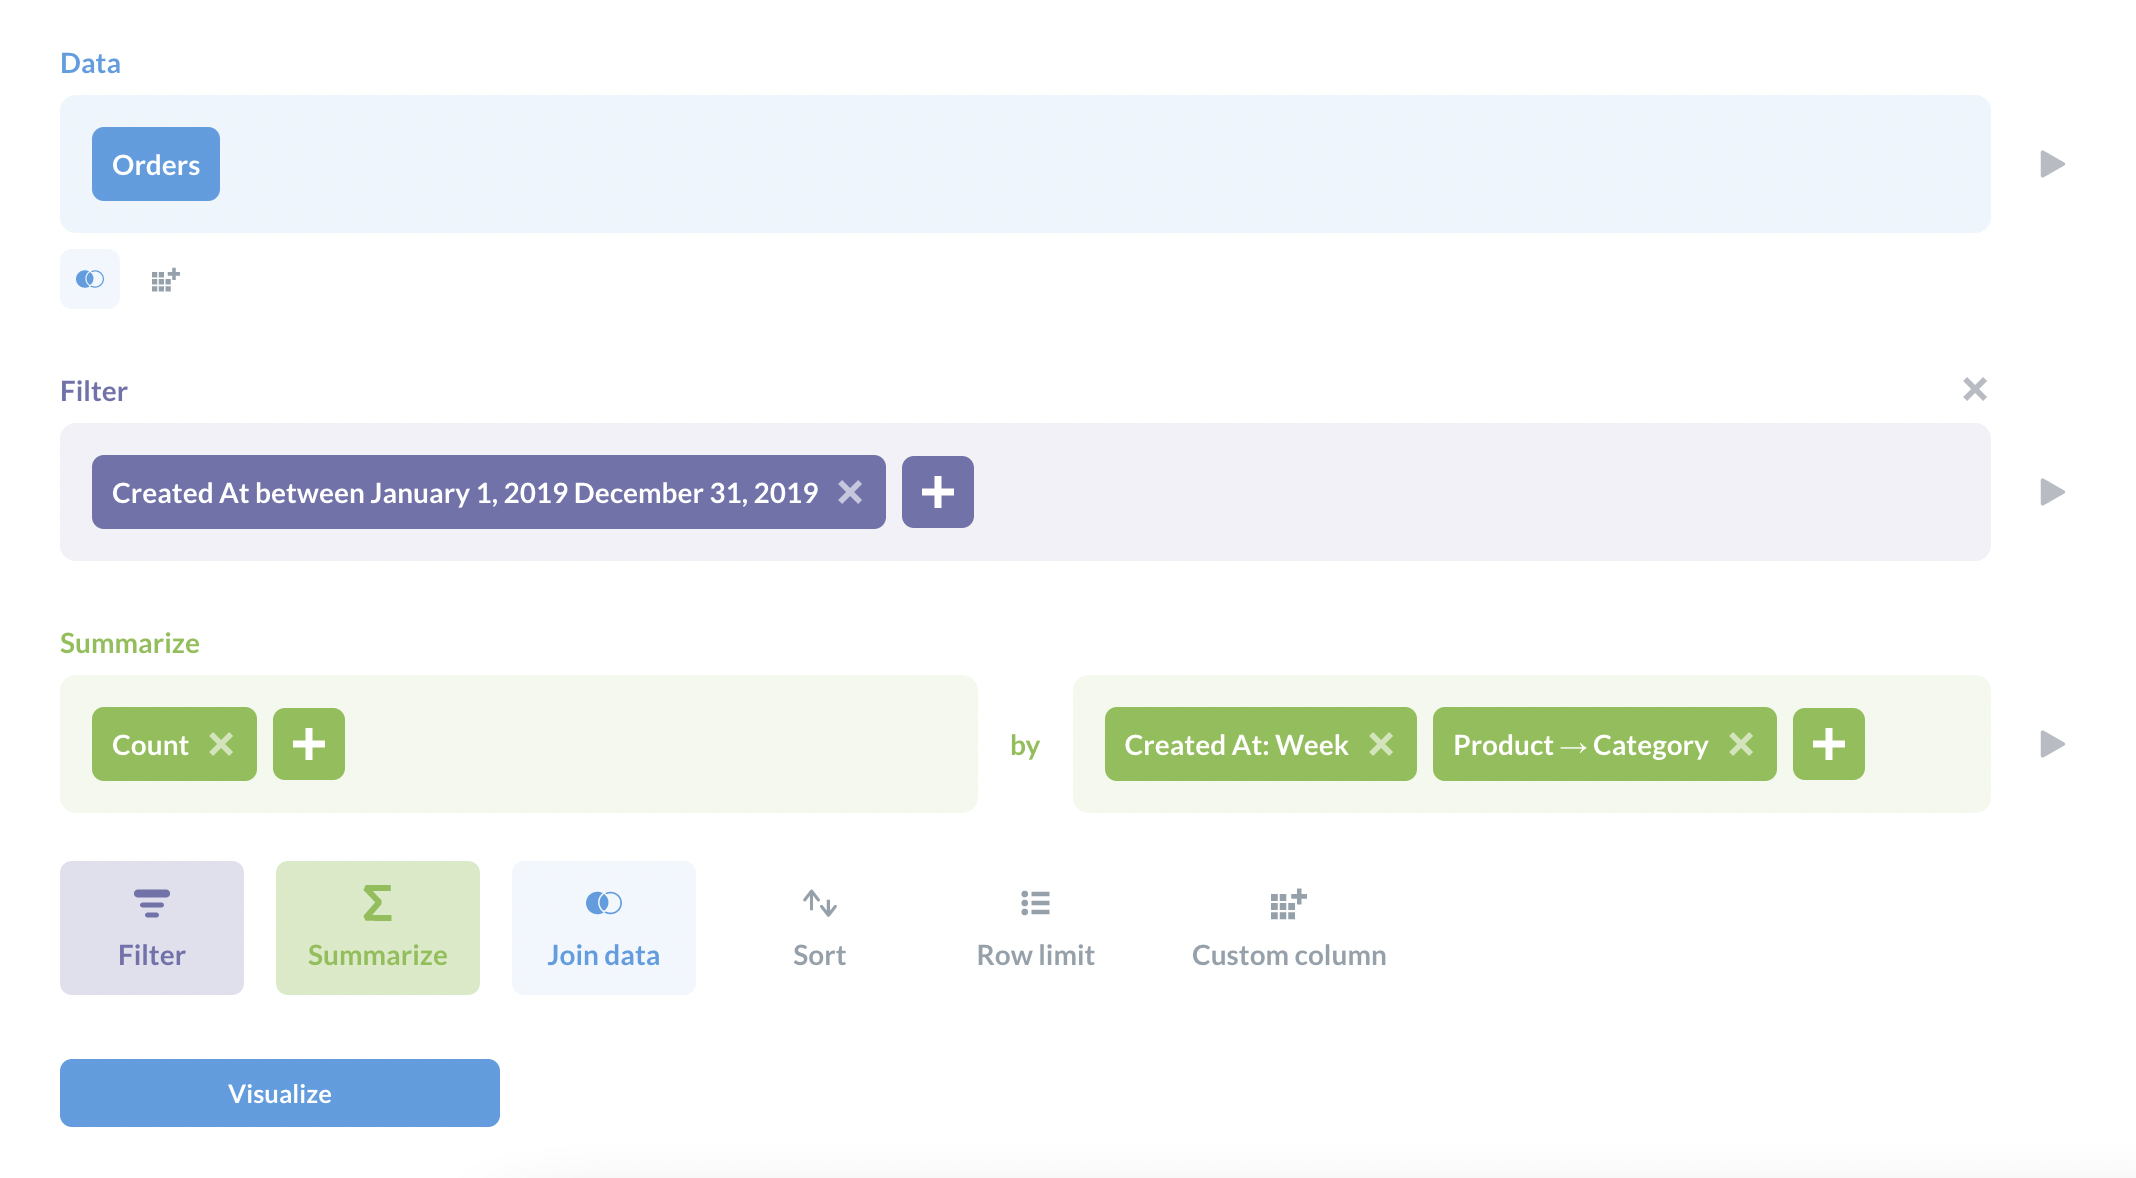
You can use AIDEM Analytics’s query builder to filter and summarize data.
Use the Notebook editor to ask more sophisticated questions. With custom expressions, you can accomplish pretty much anything you’d be able to do with SQL: join tables, create custom columns, filter and group results, compare time series, and more. Plus, people who don’t know SQL can duplicate your question and use it as a starting point for another question.
Query builder questions automatically get an action menu applied to their visualizations, allowing people to click on a table or chart to drill through the data.
Questions asked with the query builder can start with a model, a raw table, or with the results of a saved question, and you can convert them to native SQL at any time.
Native Queries
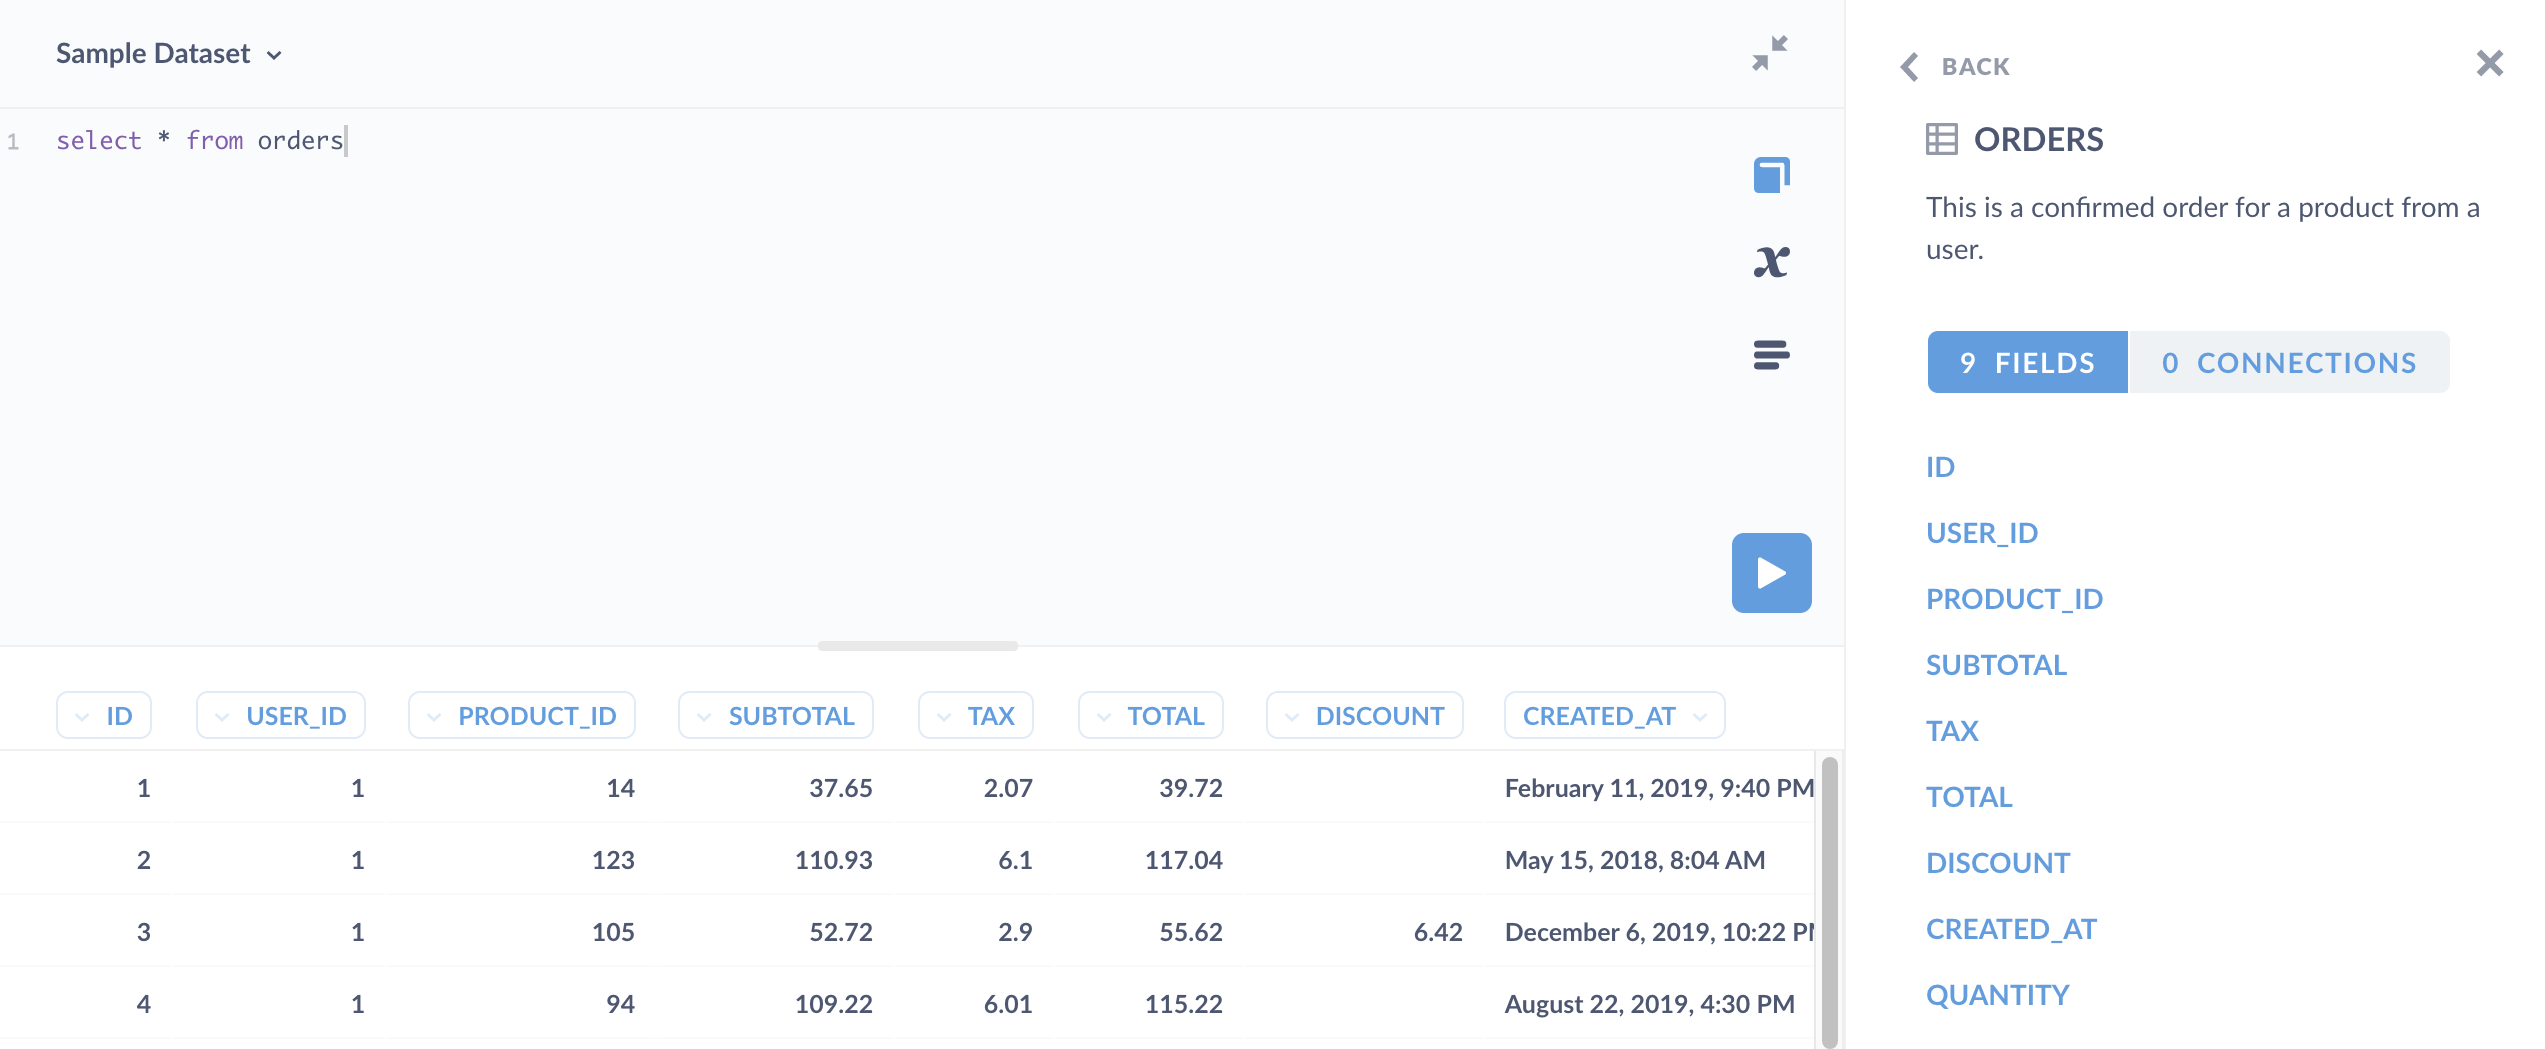
Use the native query editor to compose questions in the database’s native query languages (typically SQL for relational databases, but also other query languages for data sources like MongoDB and Google Analytics). For questions written in SQL, you can use variables in your code to create SQL templates, including field filter variables that can create smart dropdown filters.
Like query builder questions, you can use the results of models or saved questions as starting points for new questions, just as you would a table or view. For example, to reference question 123 like so:
WITH gizmo_orders AS #{123}
Create models to use as starting data for new questions
Models are built with questions from either the query builder or the SQL editor. You can use them to pull together data from multiple tables, with custom, calculated columns, and column descriptions and other metadata, to create great starting data for people to ask new questions. For example, you could build a model for “Active users”, or “Priority orders”, or however you want to model your business.
If you find that you’re using the same saved question over and over as your starting data for new questions, you may want to convert that saved question to a model, which will let you add metadata like column descriptions and column types. You can also refer to models in SQL queries, just like we did above with saved questions.
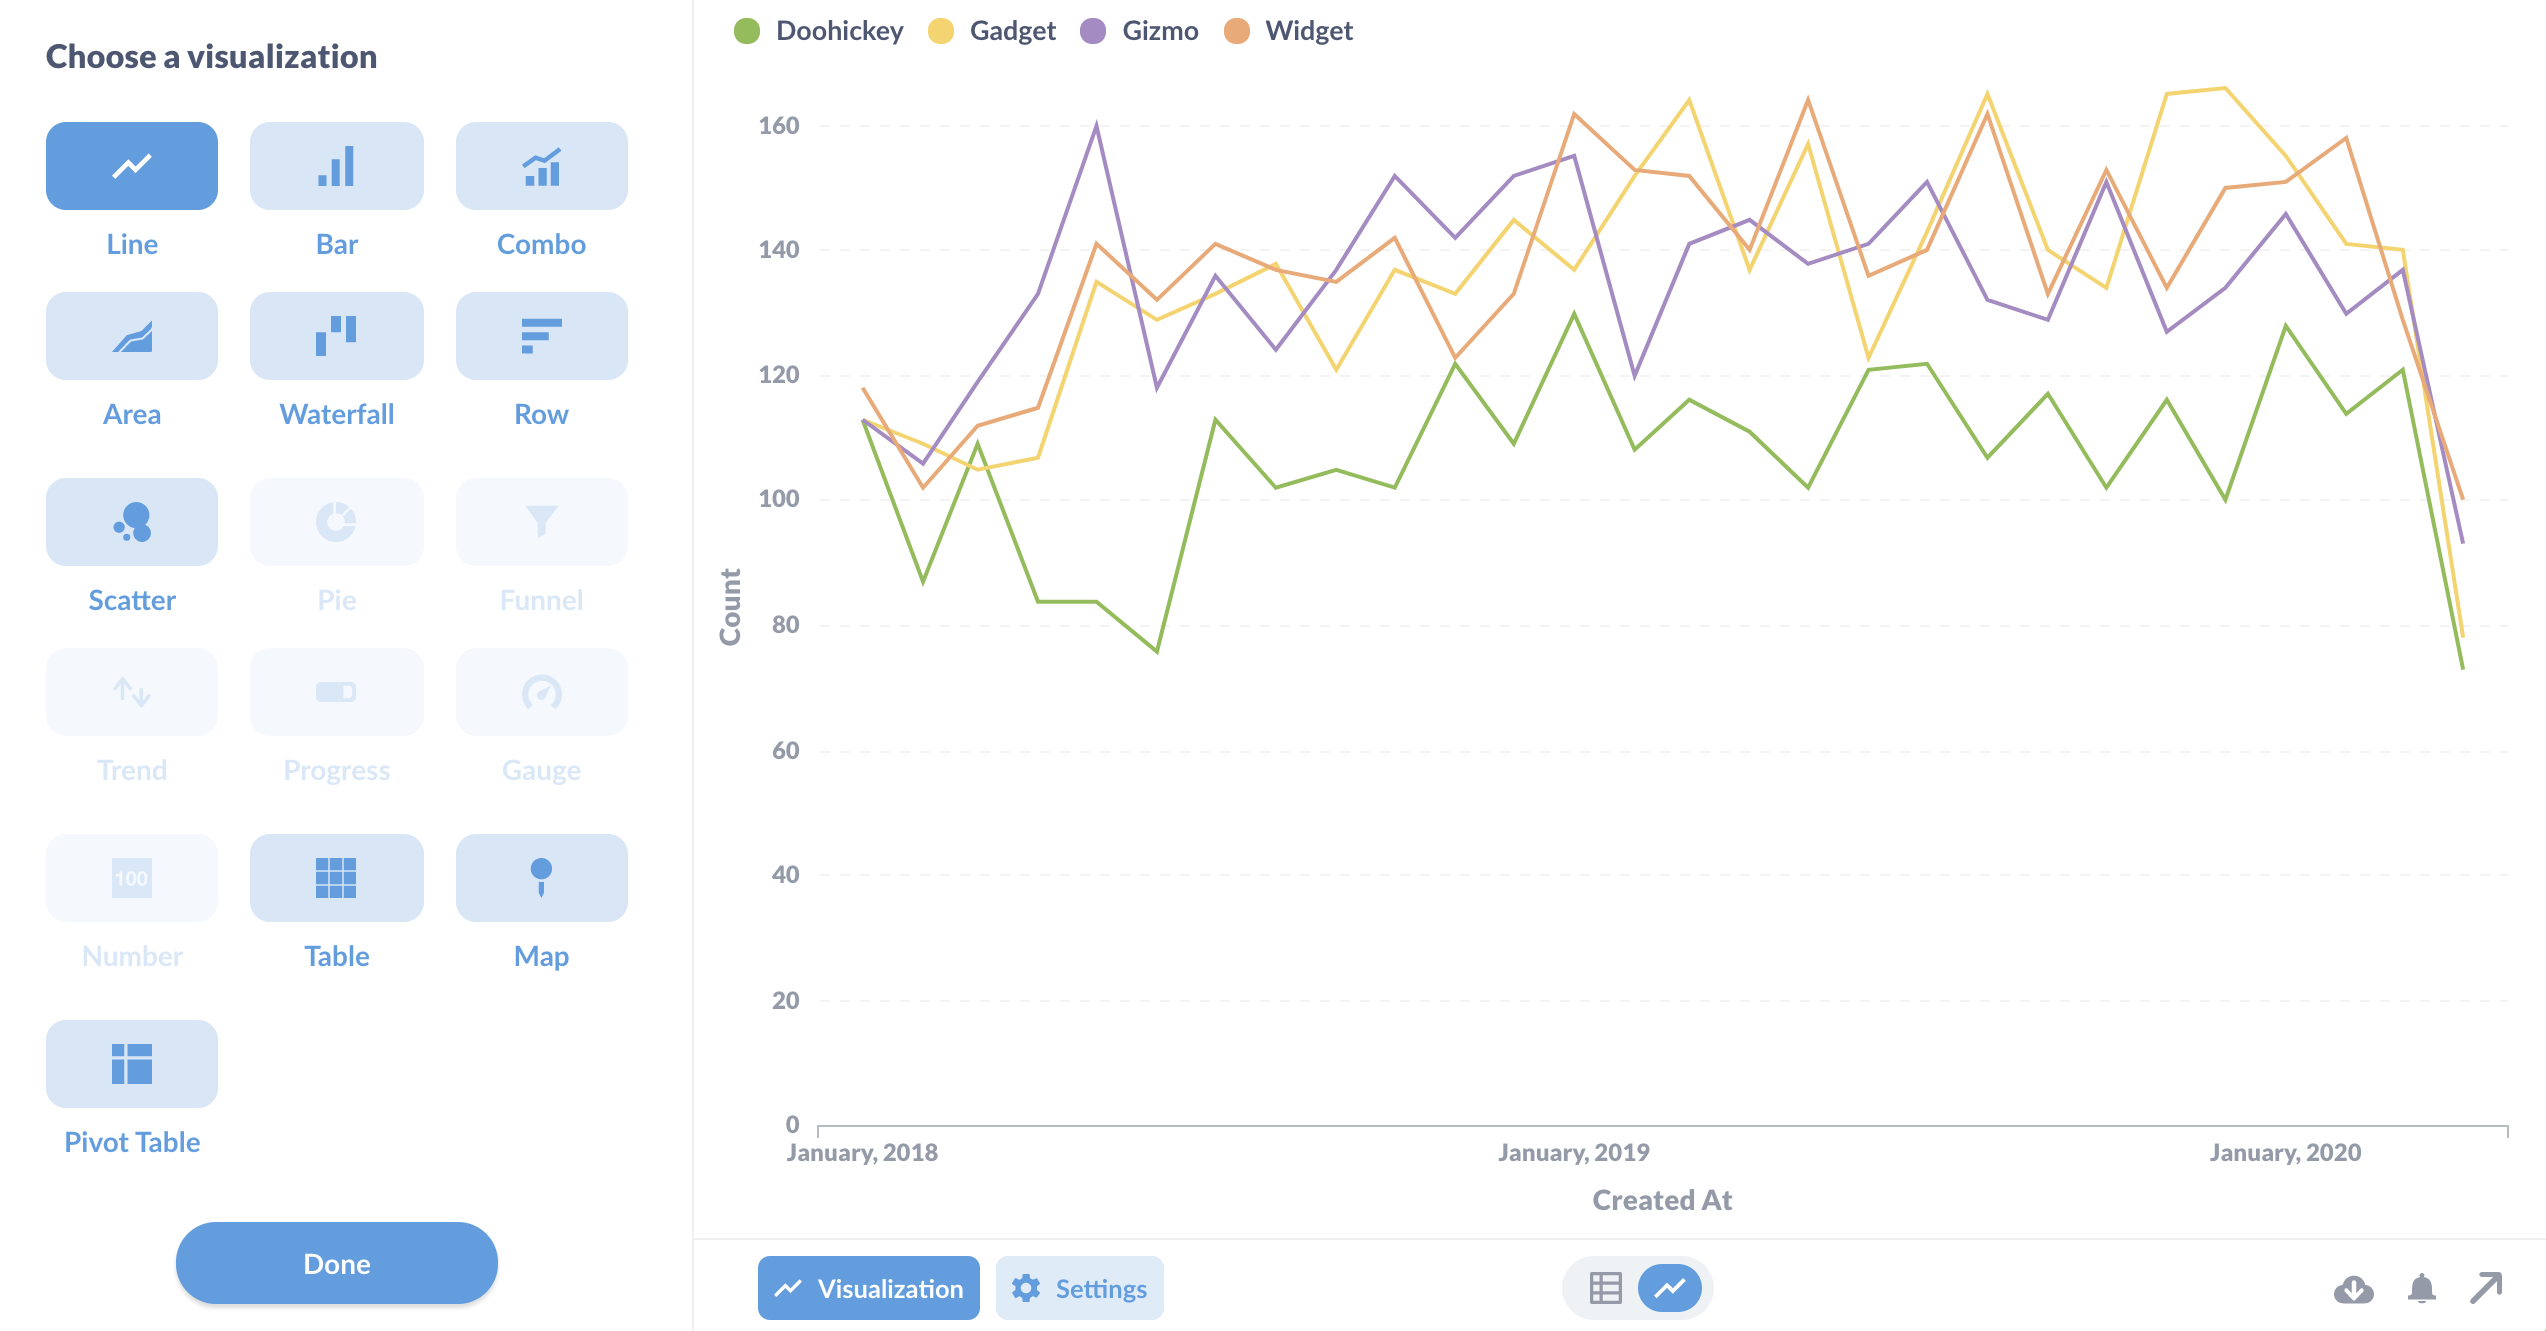
Visualize results
When you ask a simple or custom question, AIDEM Analytics will guess at the most appropriate visualization type for the results, but you can select from sixteen different visualization options.
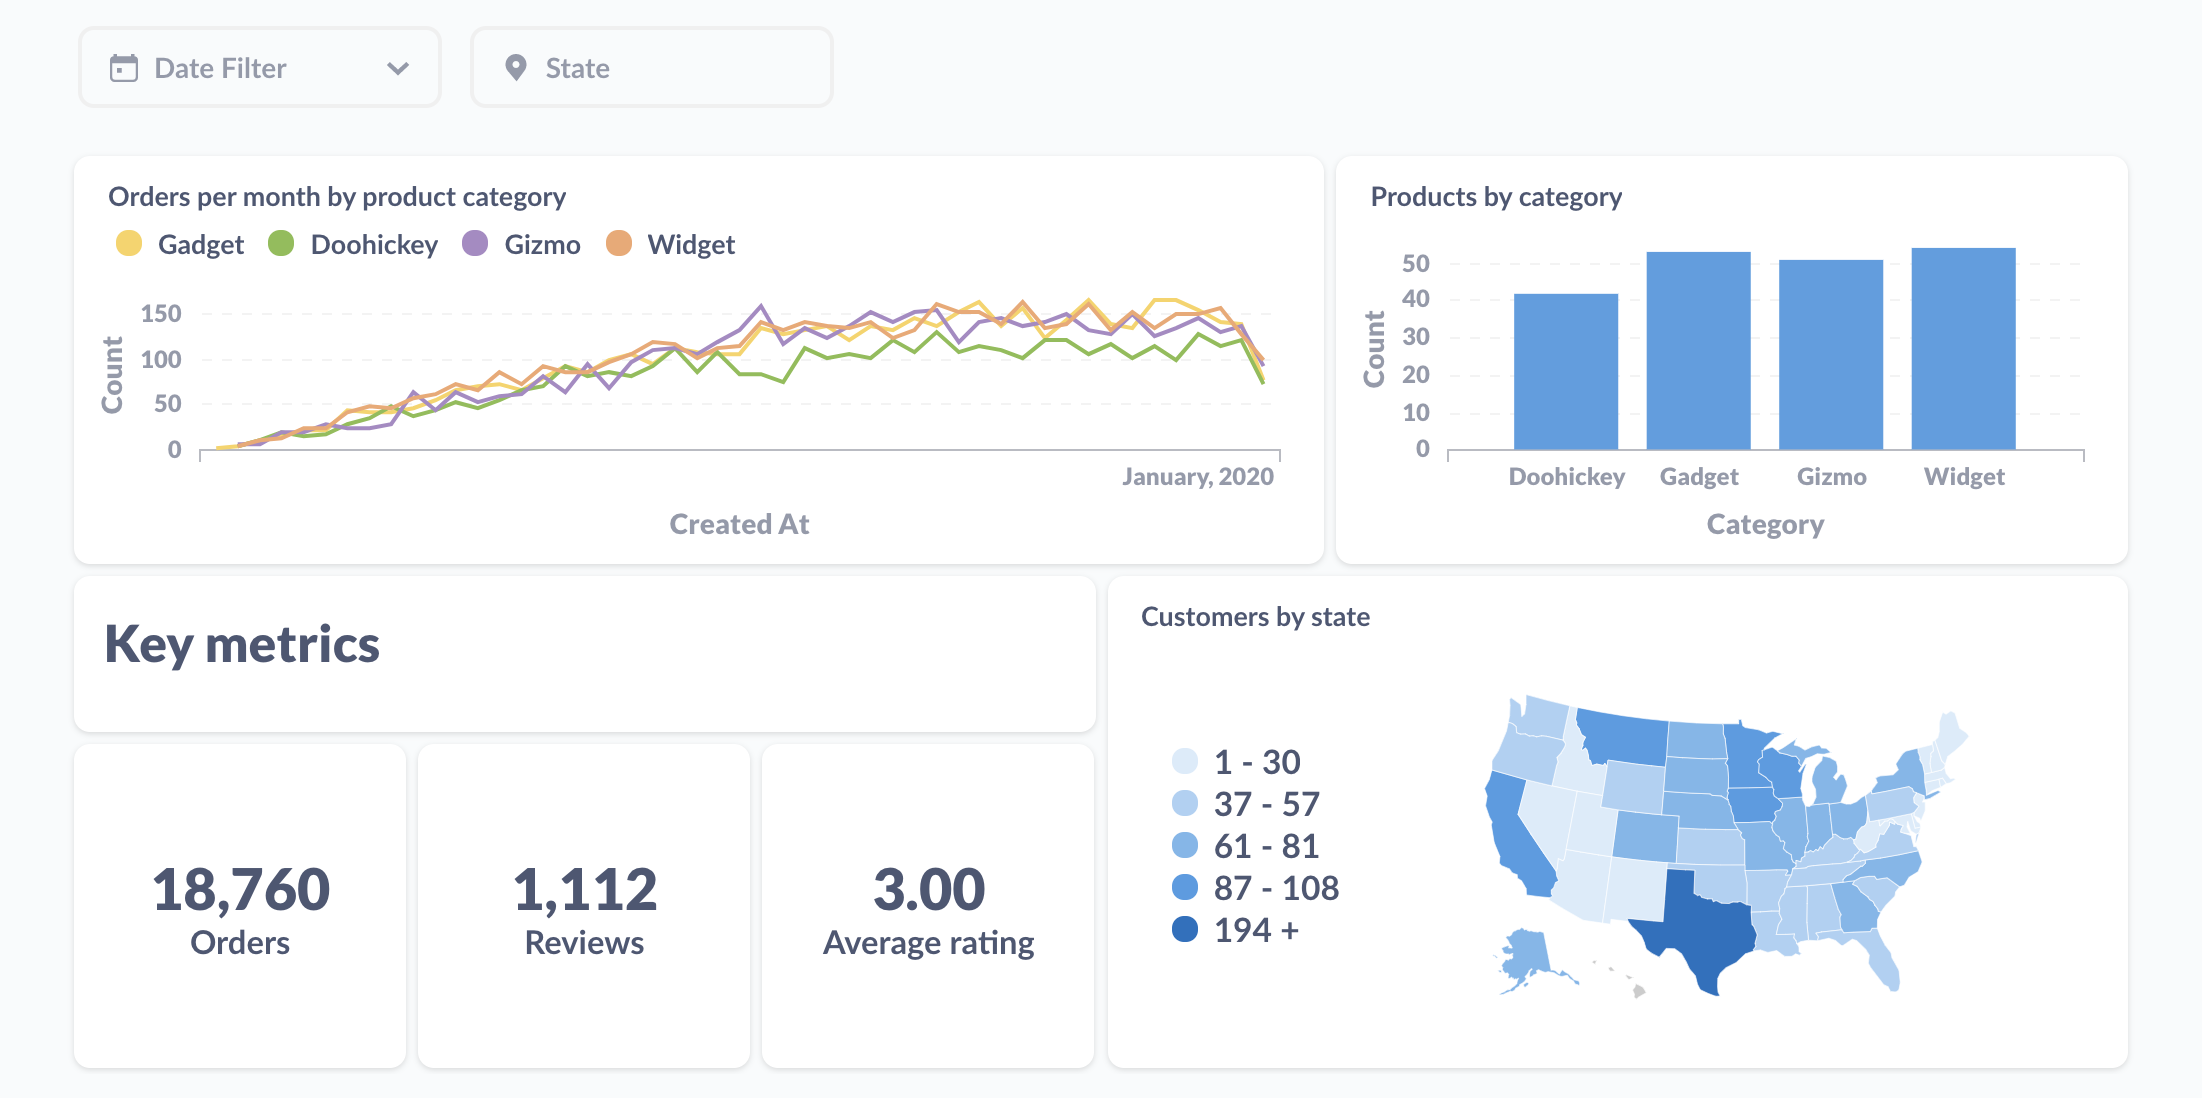
Create interactive dashboards
You can organize questions and models into a dashboard, and contextualize them with Markdown text cards.
You can add filters to dashboards and connect them to fields on questions to narrow the results.
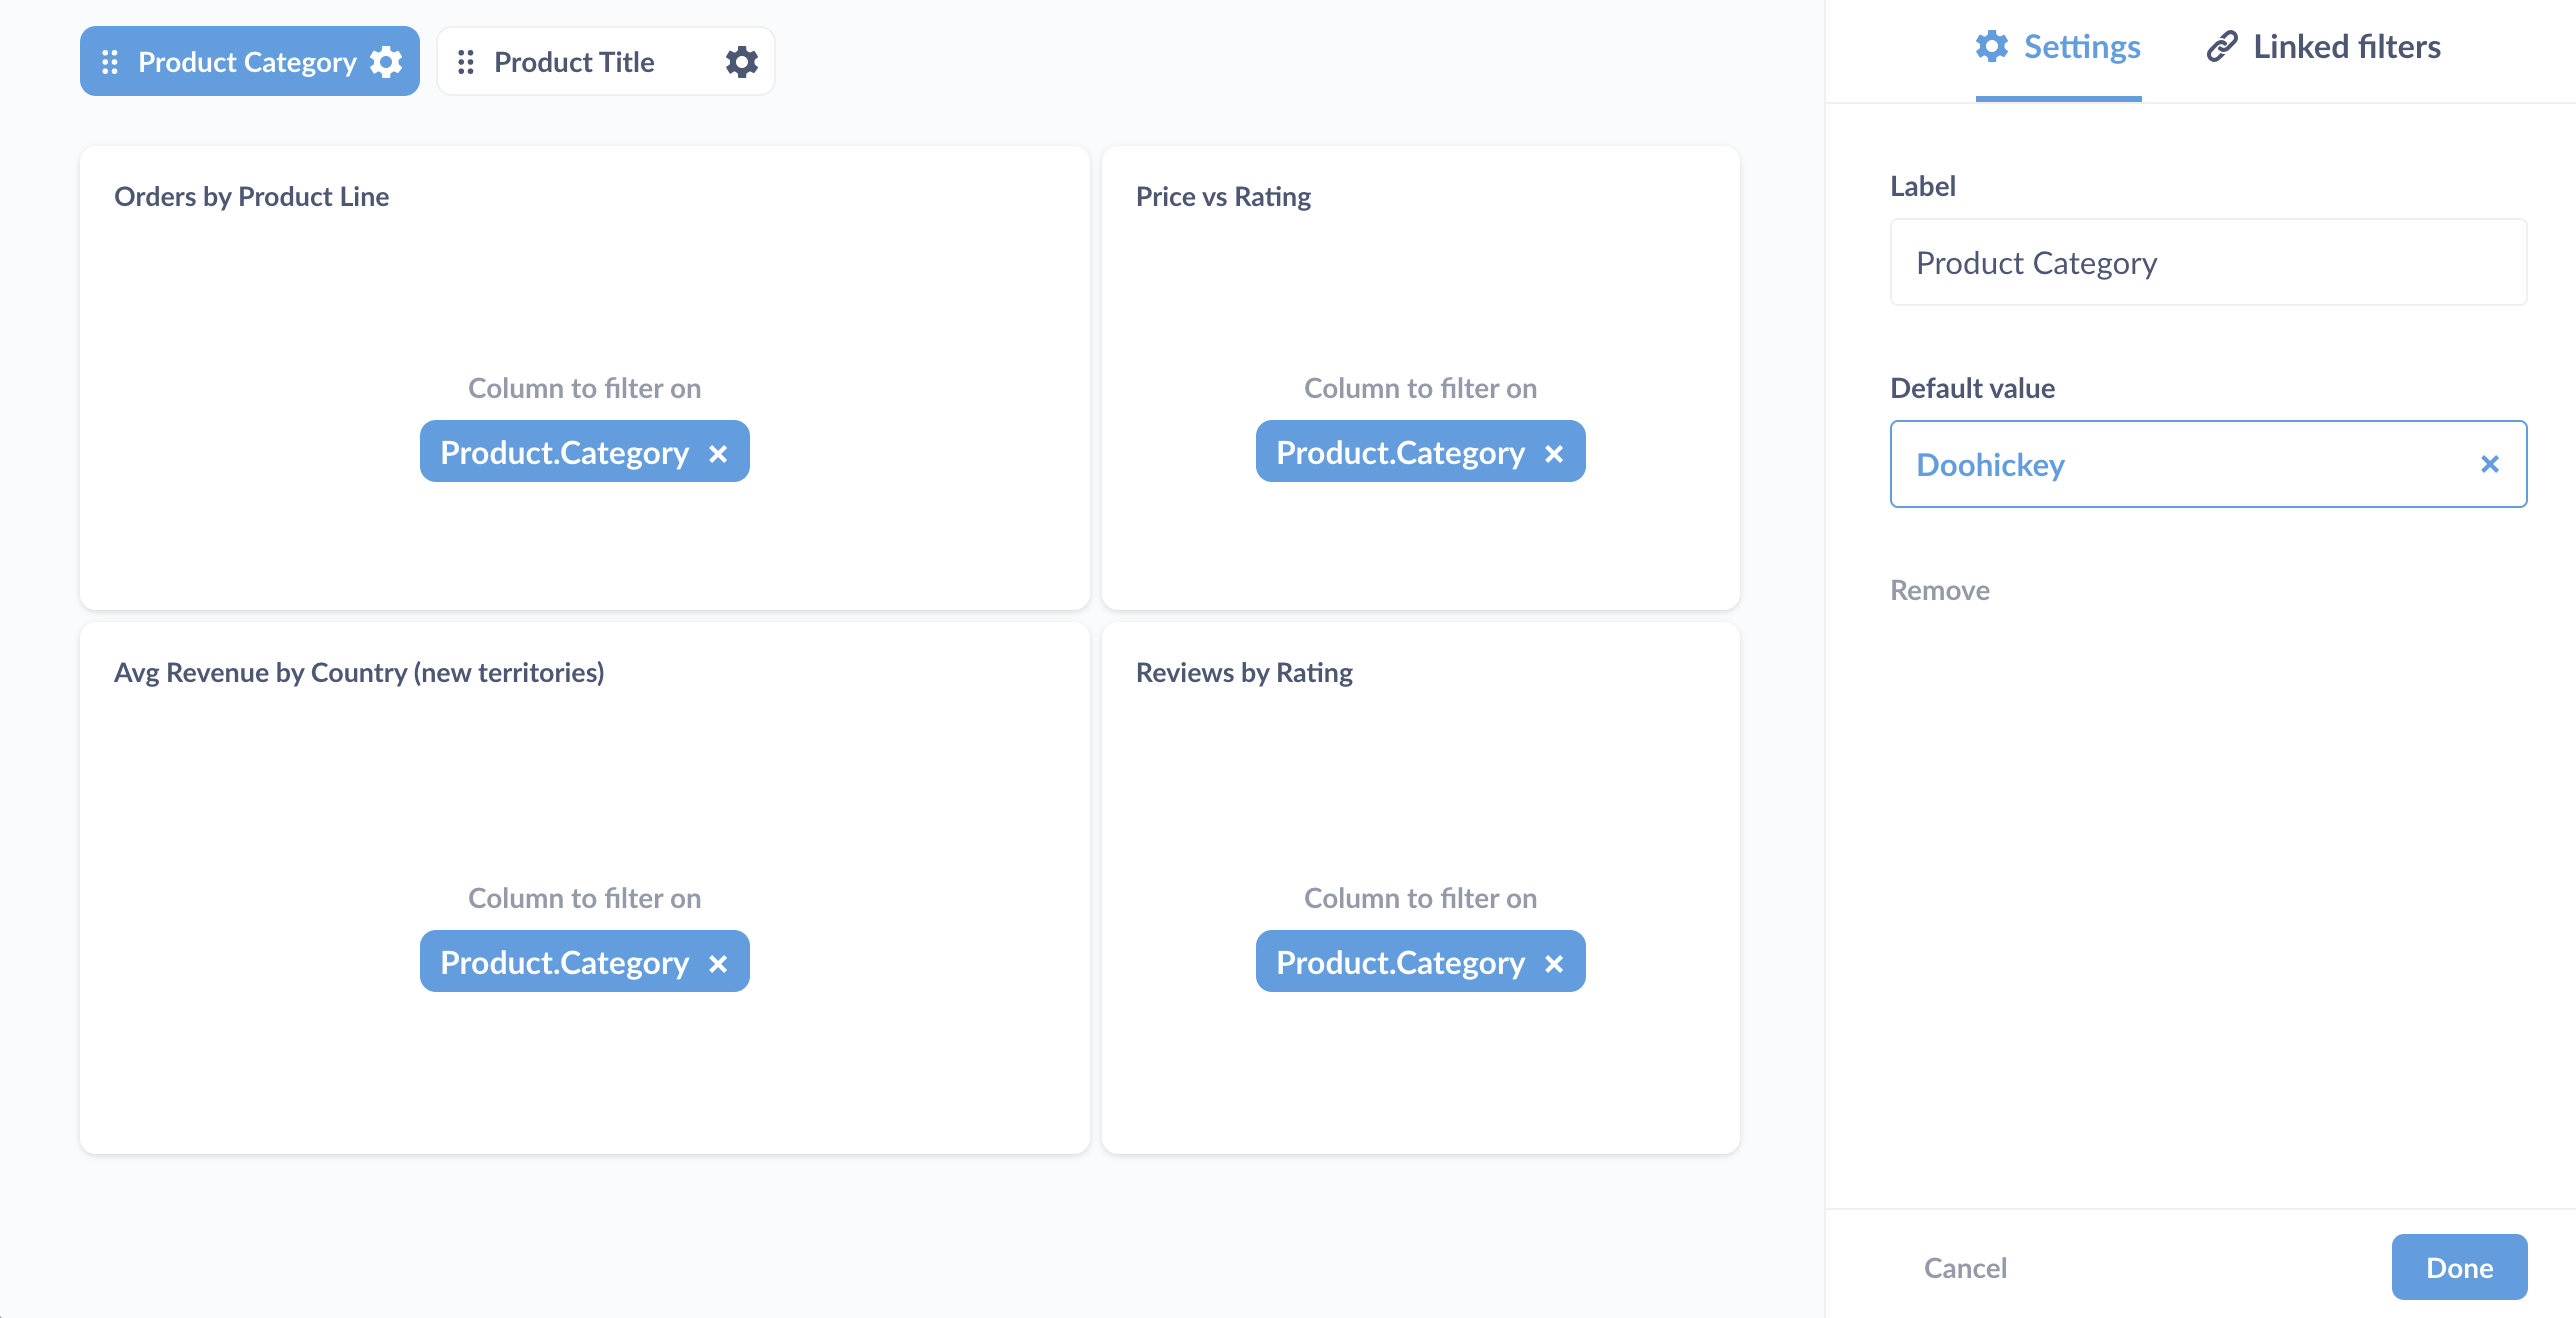
You can link filters, create custom destinations (to send people to another dashboard or external URL), or even have a chart update a filter on click.
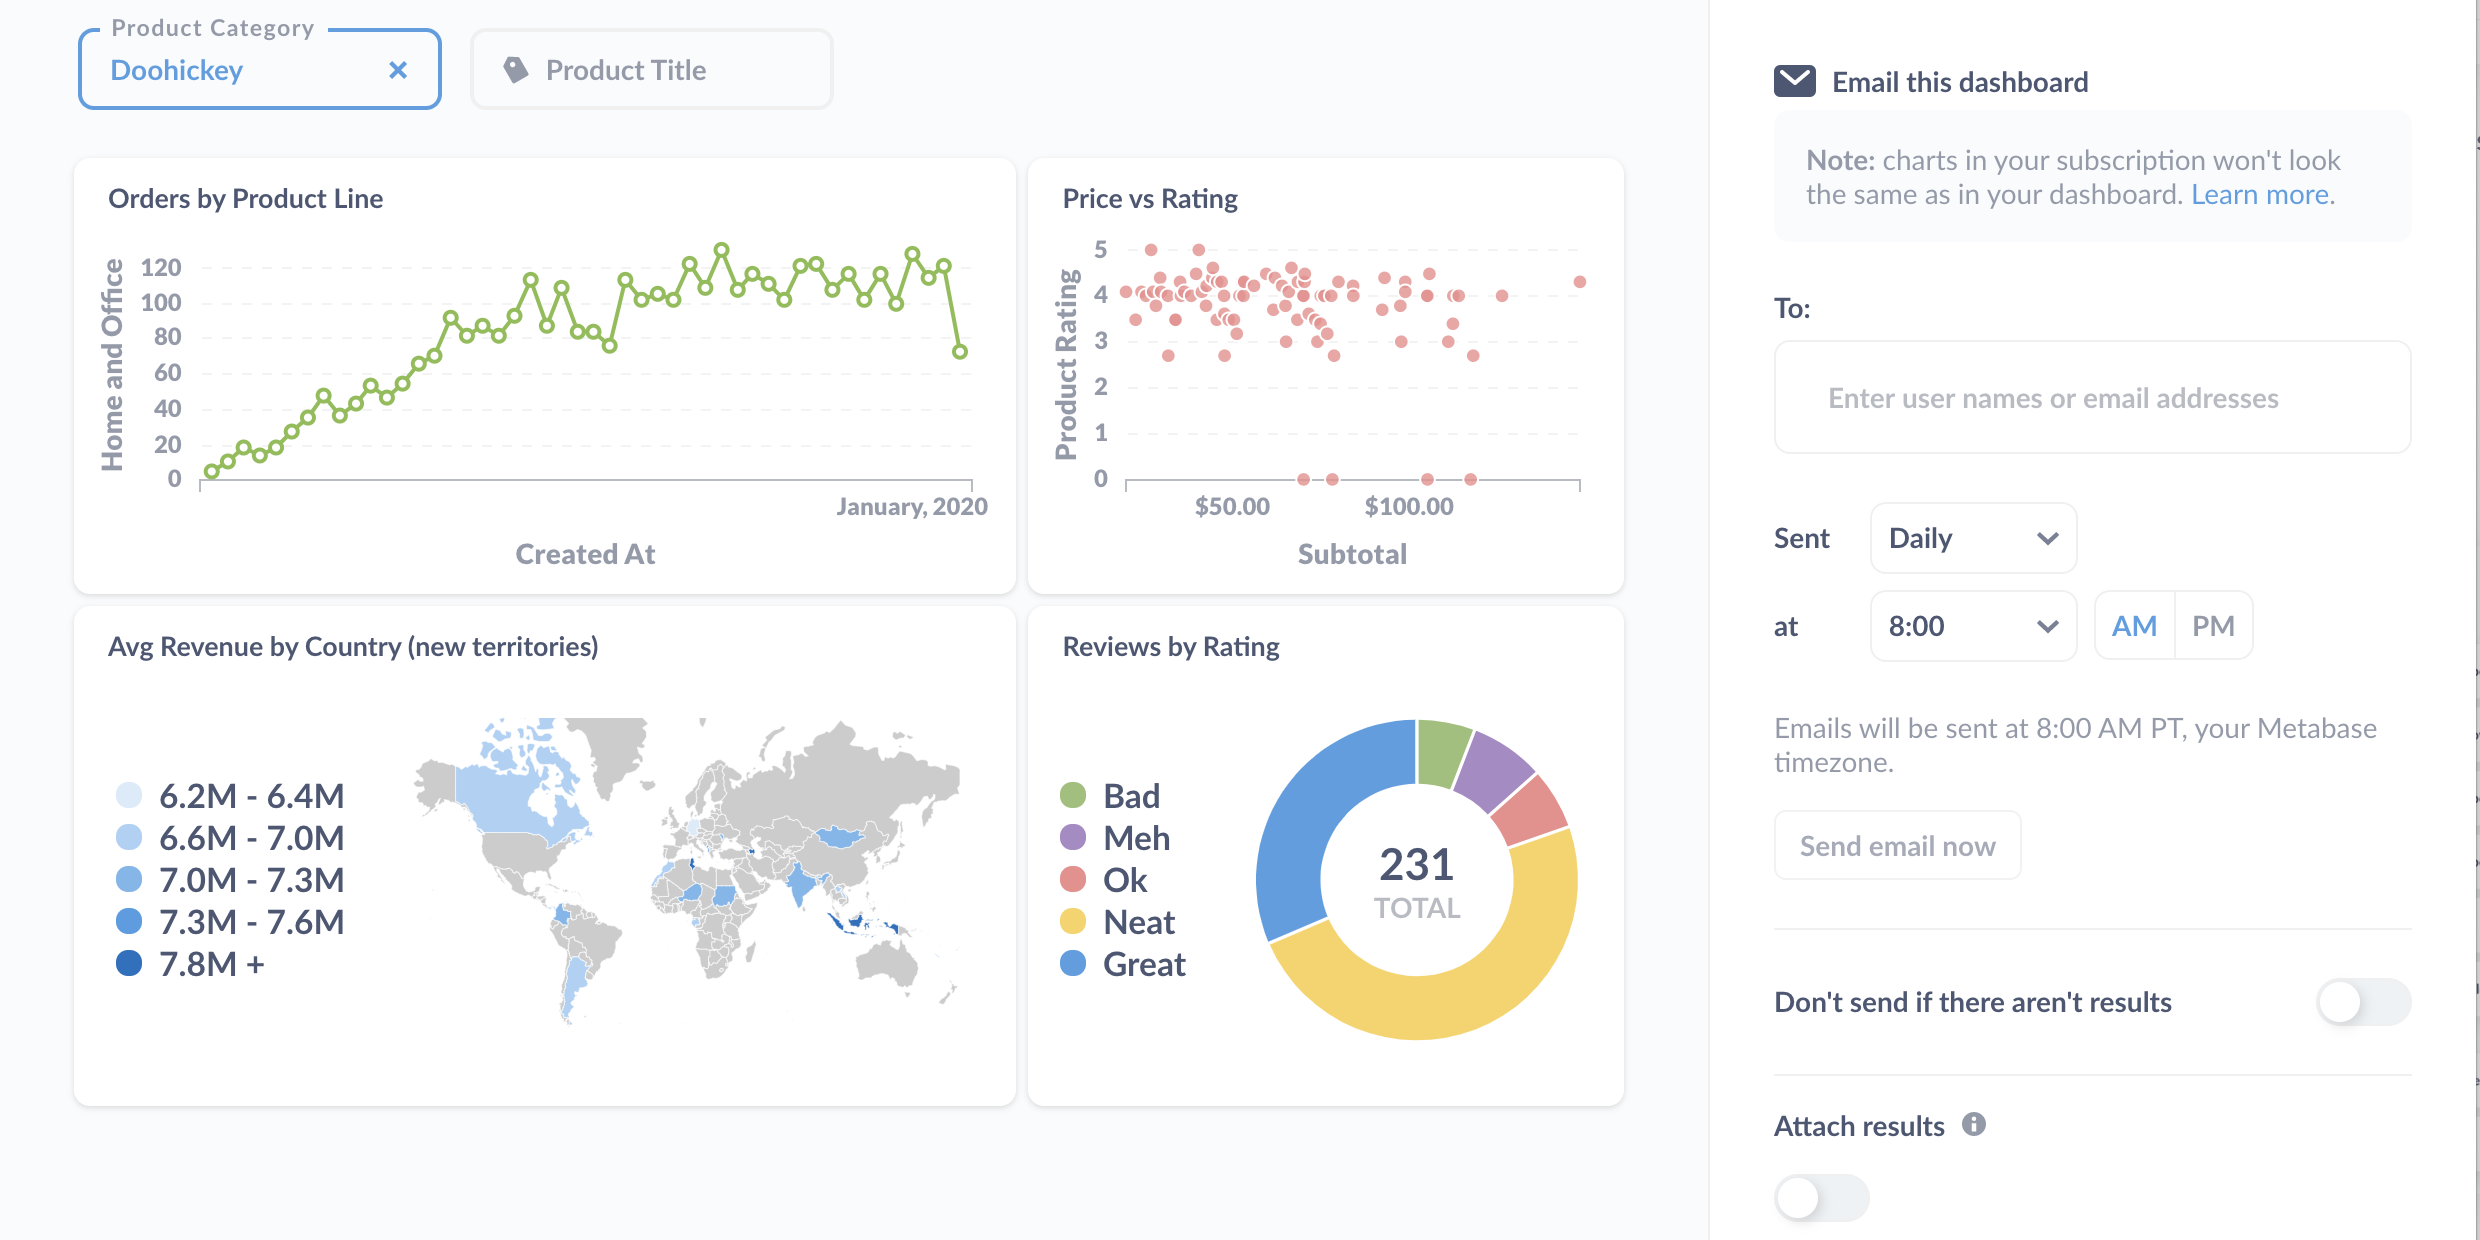
To keep people posted on key metrics, you can set up dashboard subscriptions via email or Slack.
How to find things and stay organized
Things in this case being databases and their analysis: the questions, dashboards, and collections you and your teams create.
Search
You know, to find things: data, metrics, segments, dashboards, models, and questions. You’ll probably use the search bar the most often, but the catch here is that you need to know what to search for.
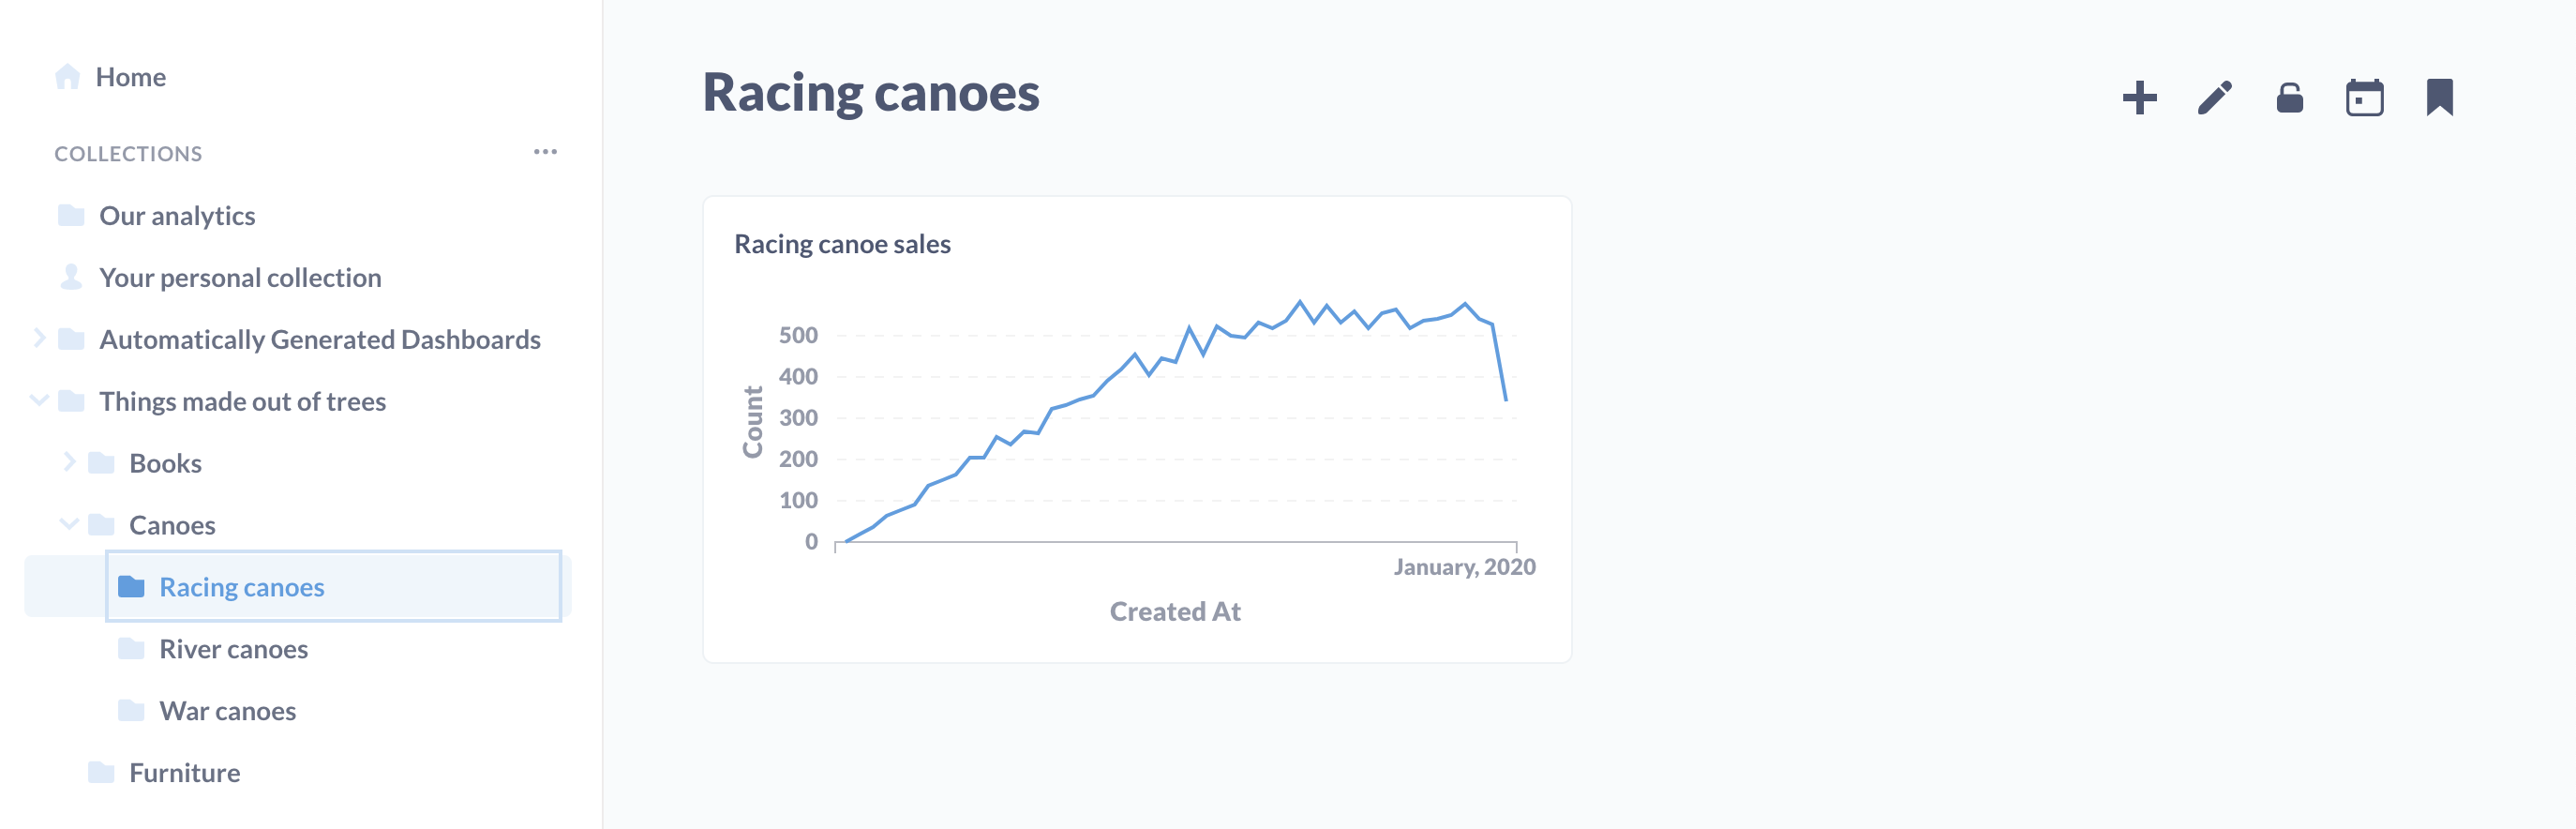
Organize with collections
Collections organize questions, models, dashboards, and other collections. They work like folders on a file system, and you can set permissions on collections, giving some groups edit, view, or no access. Groups with edit access to a collection can pin the most important items to the collection - your “official” dashboards.
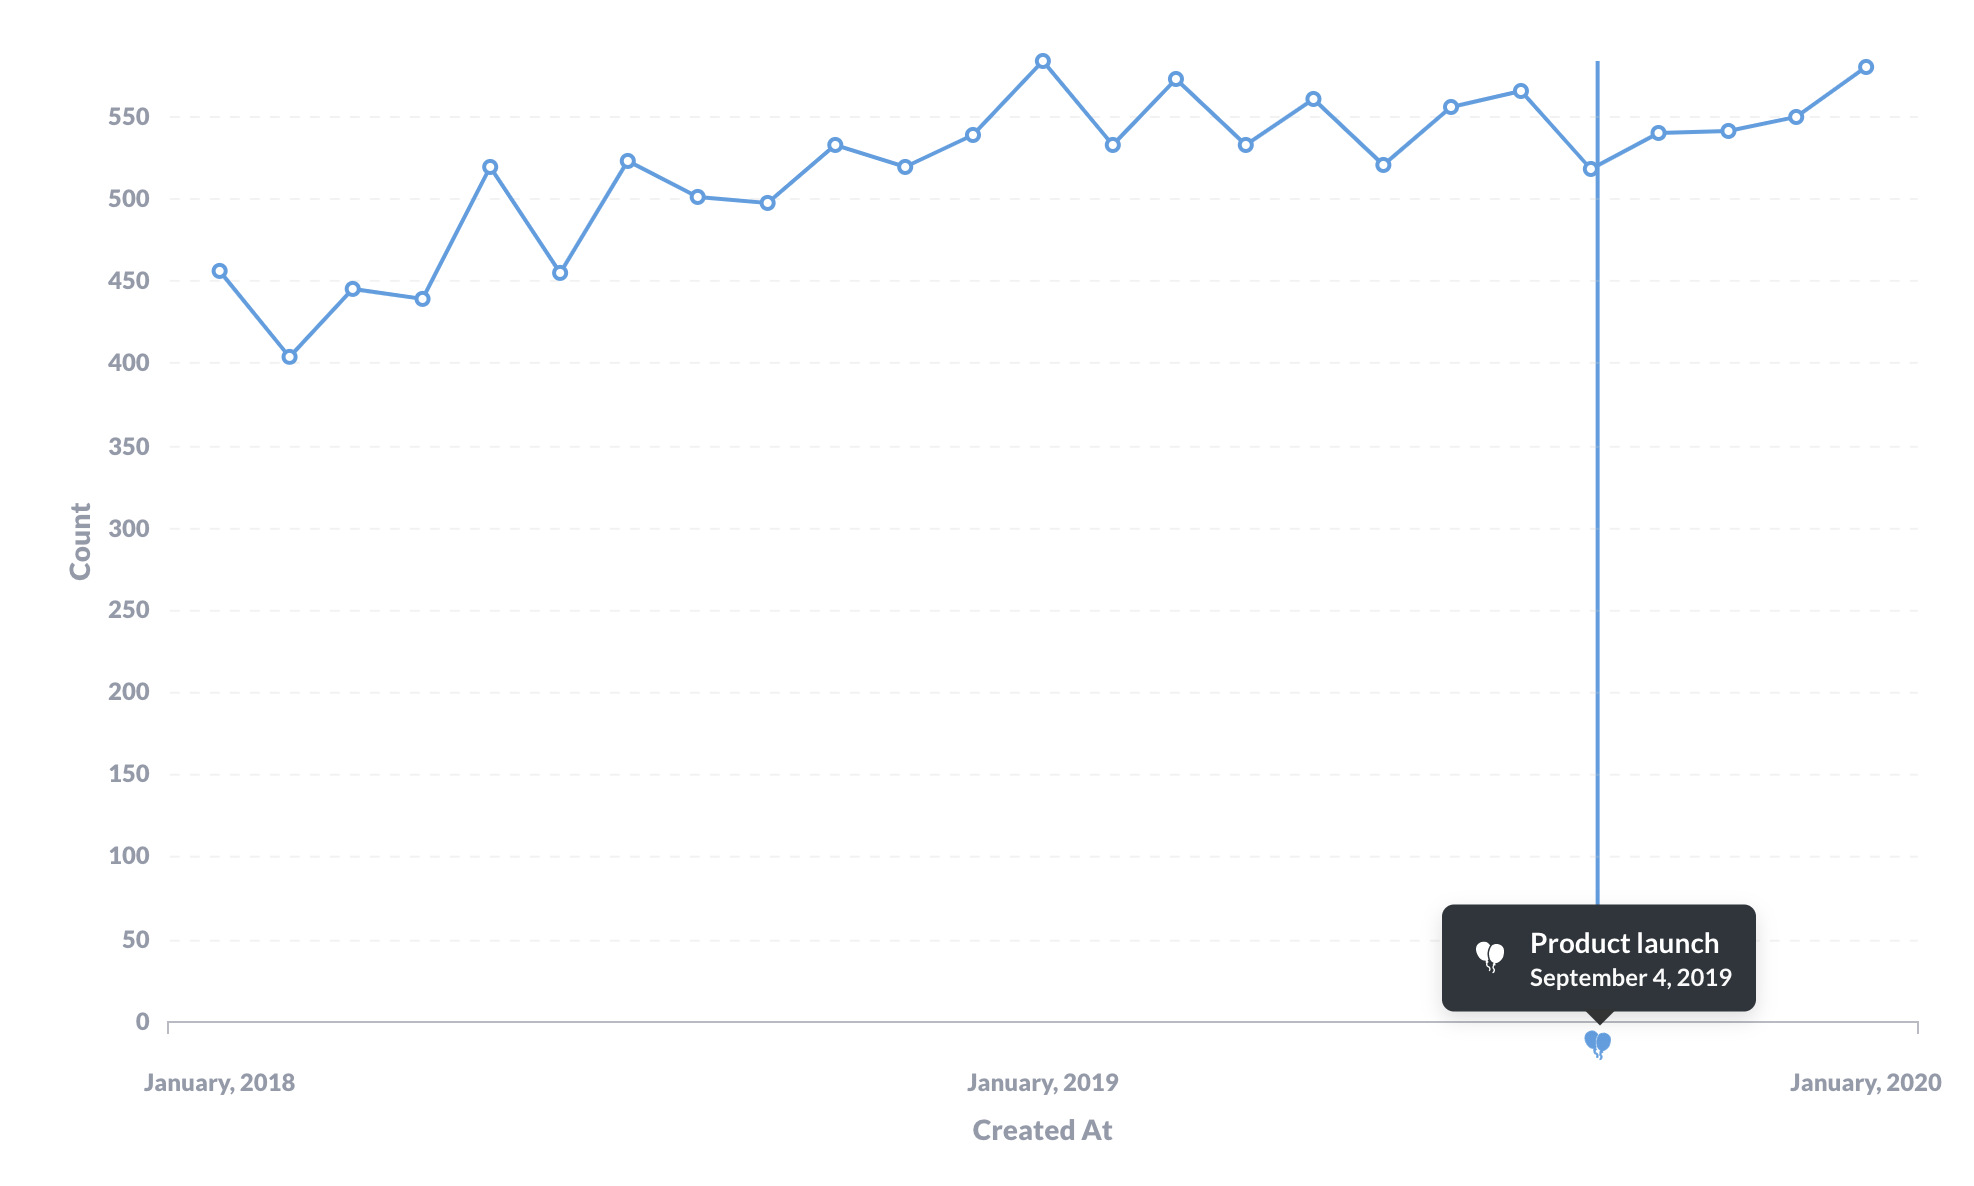
Events and timelines
Events and timelines let you capture important dates and make that knowledge available when you need it (that is, when you’re viewing a time series). You can organize events into timelines, and associate those timelines with collections.
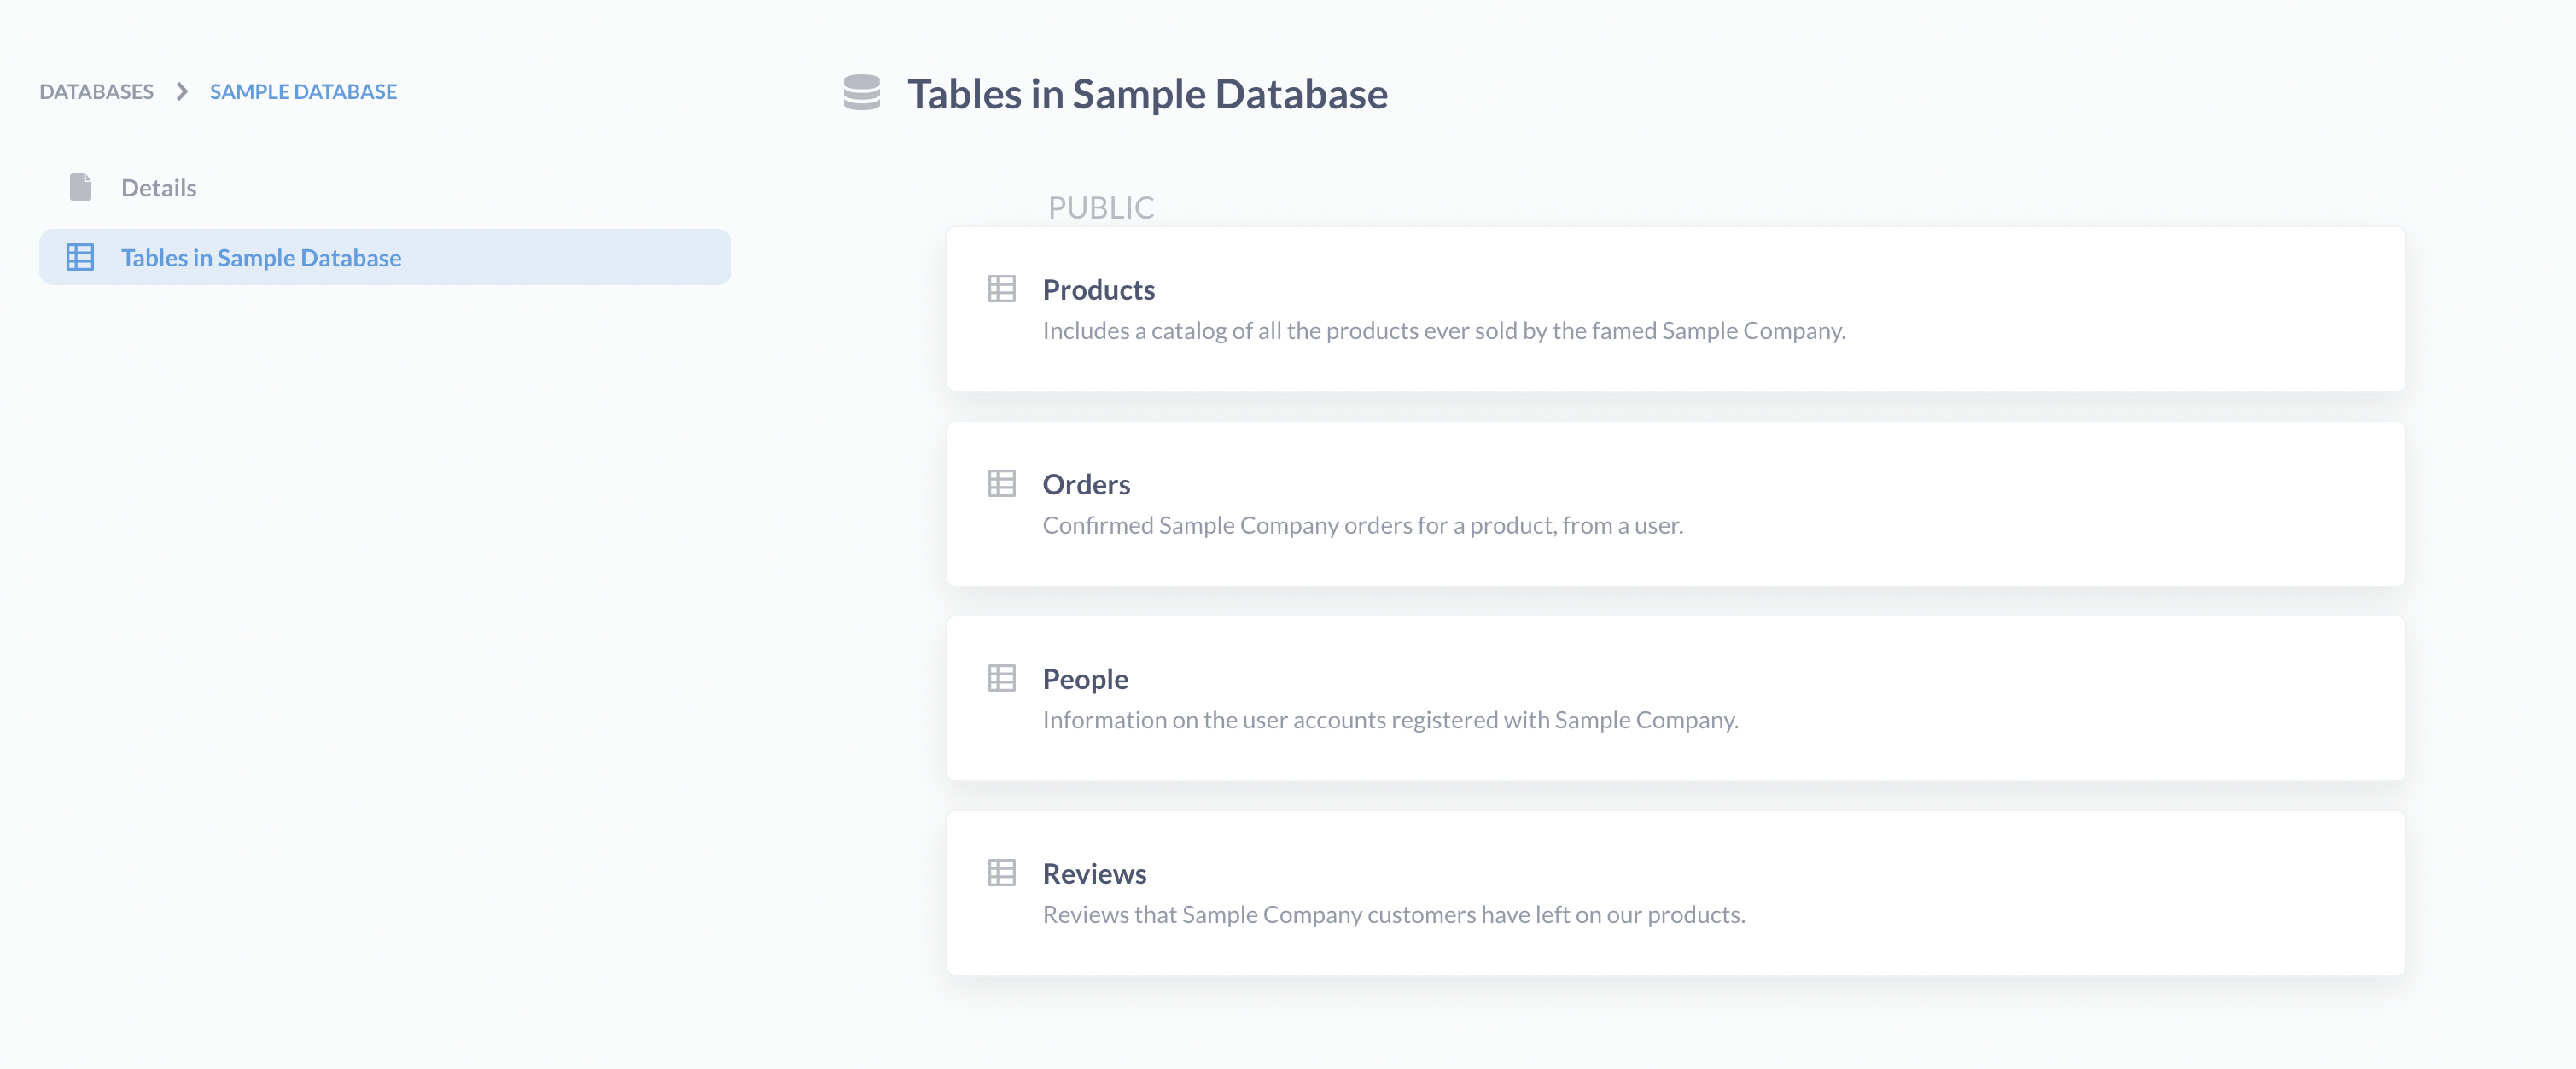
Browse data
The data browser lists all of your databases, and gives you space to add context. You can browse tables and their fields, see sample data, as well as a list of questions that query that data.